

If you’re building a dividend income stream, an SCHD calculator answers one simple question: how much could your investment in the Schwab U.S. Dividend Equity ETF (SCHD) pay you, this year and every year after?
The fund’s combination of a moderate starting yield and a strong dividend growth track record makes it one of the most-modeled ETFs among income investors, so it’s worth understanding exactly what a calculator does, what inputs matter, and how the numbers actually compound over time.
SCHD at a Glance
SCHD is a passively managed ETF that tracks the Dow Jones U.S. Dividend 100 Index and has been domiciled in the United States since it was formed in October 2011. As of late September 2026, SCHD traded around $33.68, carrying a 3.0% annualized forward dividend yield and a $112 billion asset base, one of the largest dividend-focused ETFs in the market. Its expense ratio sits at just 0.06%, which matters enormously for compounding because almost none of your return is eaten by fees.
A key structural detail for anyone building a calculator model: SCHD underwent a 3-for-1 share split in October 2024. If you’re comparing older price or dividend-per-share data to current figures, adjust for that split first, or your numbers will be off by a factor of three. Schwab
| Metric | Approximate Value (Sept 2026) |
|---|---|
| Share Price | ~$33.70 |
| Dividend Yield | ~3.0% |
| Annual Dividend/Share | ~$1.05 |
| Distribution Frequency | Quarterly |
| Expense Ratio | 0.06% |
| Assets Under Management | ~$112 billion |
| Inception Date | October 20, 2011 |
SCHD Holdings and Dividend Strategy
SCHD doesn’t chase the highest yield available. Instead, its underlying index screens roughly 100 U.S. companies for dividend sustainability, using metrics like cash flow to total debt, return on equity, dividend yield, and five-year dividend growth. That screening is why SCHD is often described as a “dividend growth” ETF rather than a “high-yield” one.
Recent top holdings have included names like UnitedHealth Group, Texas Instruments, Merck, Coca-Cola, Chevron, and Amgen, spread across sectors such as healthcare, consumer staples, energy, and technology. No single stock typically exceeds roughly 4-5% of the portfolio, which keeps company-specific risk in check while still concentrating enough in quality dividend payers to support meaningful yield. snowball-analytics.com
SCHD Dividend Payments, Yield and Share Price
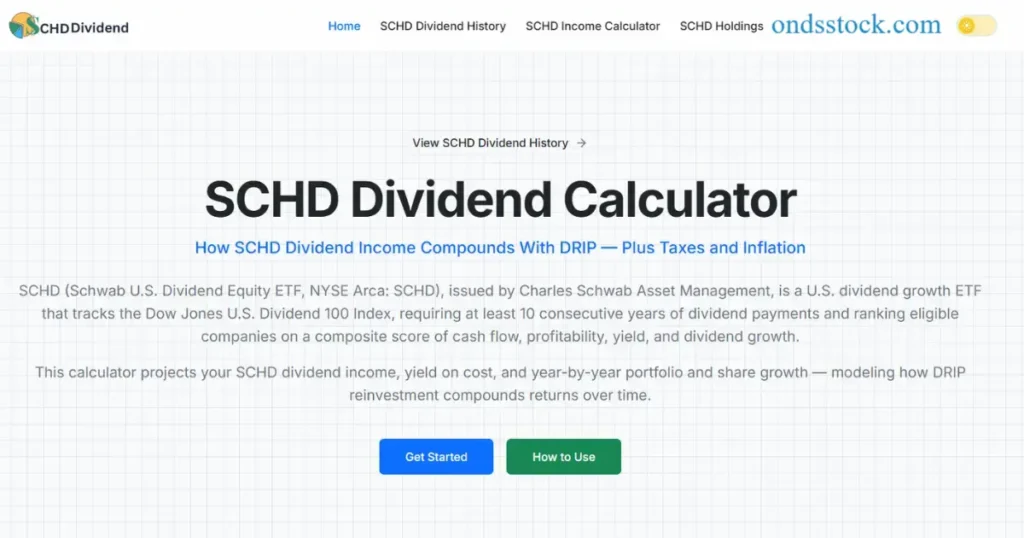
Short answer: SCHD pays a quarterly dividend that has grown almost every year since inception, currently totaling around $1.05 per share annually, or roughly 3.0% of the current share price.
Dividend payments are declared quarterly, and the payout has generally trended upward as underlying holdings raise their own dividends. This is the mechanism an SCHD calculator is built to model: a starting yield, plus a dividend growth rate, compounding on top of any share price appreciation.
Two numbers matter most when running projections:
- Current yield — what you’d earn today on a lump-sum investment, before any growth.
- Dividend growth rate (CAGR) — how fast the per-share payout has historically increased, which determines how quickly your yield on cost rises over time.
SCHD Dividend History and Growth
SCHD’s dividend growth has been one of its defining features. The fund’s three-year average dividend growth rate has run around 8.19%, and it has now paid dividends for roughly 18 consecutive years through its underlying holdings’ track record. That growth rate is why long-term SCHD holders often see their yield on cost climb well above the fund’s current headline yield within a decade.
It’s worth noting that dividend growth rates fluctuate year to year depending on how aggressively underlying companies raise payouts, sector performance (energy and healthcare weightings can swing results), and broader economic conditions. A calculator should let you test a range of growth-rate assumptions rather than relying on a single historical average.
SCHD Dividend Income Calculator: What to Input
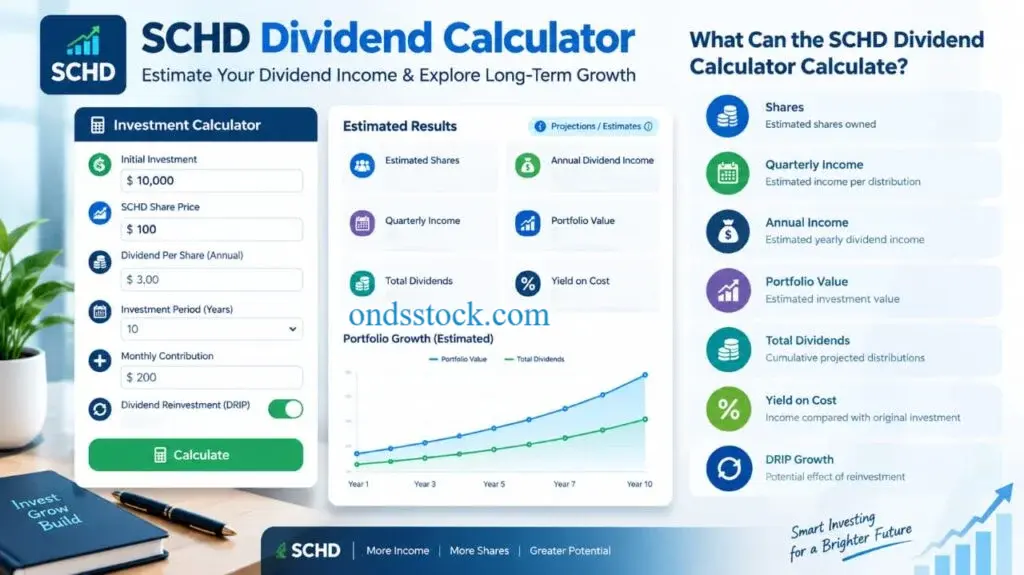
An SCHD calculator typically asks for the following inputs, each of which meaningfully changes your projection:
- Initial investment or starting share count — your lump-sum starting point.
- Current share price — used to convert dollars into shares (accounting for fractional shares if your broker allows them).
- Dividend yield — the current annual yield, applied to your invested capital.
- Dividend growth rate — your assumed annual CAGR for the payout (many investors use 5-8% based on recent history).
- Share price growth rate — separate from the dividend growth rate, this estimates capital appreciation.
- Dividend frequency — quarterly, in SCHD’s case.
- Reinvestment (DRIP) toggle — whether dividends buy more shares automatically.
- Additional contributions — monthly, quarterly, or yearly extra investment amounts.
- Investment duration — the number of years you’re projecting.
- Tax rate — relevant if held in a taxable brokerage account, since SCHD’s dividends are largely qualified and taxed at capital gains rates rather than ordinary income.
How the SCHD Dividend Snowball Works
The “dividend snowball” describes what happens when reinvested dividends buy more shares, which then generate their own dividends, which buy even more shares. Over short periods the effect is modest, but over 10-20 years it becomes the dominant driver of total dividend income — often larger than the effect of price appreciation alone.
For example, an investor who reinvests dividends and adds a modest monthly contribution will typically see their annual dividend income compound faster in years 10-20 than in years 1-10, simply because the reinvested share base has grown large enough to generate meaningful new income on its own.
SCHD Dividend Reinvestment: DRIP vs No DRIP
Short answer: DRIP (Dividend Reinvestment Plan) meaningfully accelerates both portfolio value and future income; skipping it caps your growth to price appreciation plus whatever you contribute manually.
- With DRIP: Every dividend automatically buys additional shares (including fractional shares at most brokers), compounding your position without any manual action.
- Without DRIP: Dividends are paid out as cash, which can be useful if you need current income (for example, in retirement) but slows long-term portfolio growth since that cash isn’t automatically reinvested.
Most SCHD calculators let you toggle DRIP on or off specifically so you can compare a growth-phase strategy against an income-phase strategy side by side.
SCHD Dividend Growth and Yield on Cost
Yield on cost is your annual dividend income divided by what you originally paid, not the current share price. Because SCHD’s payout has grown at a mid-to-high single-digit rate historically, yield on cost tends to rise steadily for long-term holders. An investor who bought at a 3% yield and holds through several years of ~7-8% annual dividend growth could see their yield on cost climb into the 5-6% range within a decade, even without adding new capital.
SCHD Long-Term Returns and Portfolio Growth
Beyond dividends alone, SCHD’s three-year annualized total return has run around 16.2%, with a five-year annualized return closer to 10.2%, reflecting both dividend income and share price appreciation. A calculator focused purely on dividend income will understate your total return if share price growth is excluded, so it’s worth running both a dividend-only projection and a total-return projection to get the full picture.
SCHD vs VYM, DGRO and SPHD
SCHD is often compared against other popular dividend ETFs:
- VYM (Vanguard High Dividend Yield ETF) — broader diversification, typically a slightly higher yield, less emphasis on dividend growth screening.
- DGRO (iShares Core Dividend Growth ETF) — similar growth philosophy to SCHD but with a lower starting yield and different sector weighting.
- SPHD (Invesco S&P 500 High Dividend Low Volatility ETF) — higher current yield, lower historical dividend growth, more defensive sector tilt.
SCHD tends to sit in the middle: a moderate yield paired with above-average dividend growth, which is why it’s frequently used as a calculator “base case” for dividend growth investing.
Is SCHD a Good Investment for 2026?
SCHD remains a widely held core holding for dividend growth investors due to its low cost, quality screening process, and consistent payout growth. As with any single-fund strategy, sector concentration (particularly in healthcare and energy) and interest rate sensitivity are worth monitoring, and SCHD shouldn’t necessarily be a portfolio’s only holding. Its fundamentals — low expense ratio, disciplined index methodology, and a multi-year dividend growth history — are the reasons it continues to show up prominently in dividend calculator searches.
SCHD Dividend Health Check
Signs of a healthy dividend, all of which currently apply to SCHD, include: a payout ratio the underlying companies can sustain, a diversified holdings base so no single dividend cut derails the fund, a multi-year track record of raises, and a low expense ratio that doesn’t erode returns. None of these guarantee future performance, but they’re the checklist a calculator’s assumptions should be built on.
Frequently Asked Questions
What’s the best way to use an SCHD calculator with DRIP enabled?
Enter your starting investment, current yield, and an assumed dividend growth rate, then toggle reinvestment on. The calculator will compound each dividend into additional shares automatically, showing both rising share count and rising annual income over your chosen time horizon. This is the most accurate way to model long-term growth-phase investing.
Do calculators account for SCHD as an ETF versus individual stocks?
Yes — a proper SCHD calculator treats it as a single ticker with one blended yield and growth rate, unlike stock-picking tools that track dozens of individual payers. This makes projections simpler, since you’re modeling one diversified income stream rather than reconciling different ex-dividend dates and payout schedules across many companies.
What is considered the best SCHD calculator?
The best tools let you adjust dividend growth rate, share price growth, contribution schedule, and DRIP status independently, rather than using one fixed historical average. Look for a calculator that separates dividend growth from price growth and lets you export or save projections, since these assumptions matter more than the interface itself.
What do investors typically say about SCHD calculators on Reddit?
Discussion threads generally emphasize that calculator outputs are only as reliable as their growth-rate assumptions, and users commonly recommend testing conservative, moderate, and optimistic scenarios rather than trusting a single projection. Community consensus also stresses that past dividend growth doesn’t guarantee future increases.
How much dividend income would 1,000 shares of SCHD generate?
At an approximate annual dividend of $1.05 per share, 1,000 shares would generate roughly $1,050 per year in dividend income, paid quarterly in installments of about $260-265. This figure will shift as the payout grows or changes quarter to quarter.
How much dividend income would 100 shares of SCHD generate?
At roughly $1.05 per share annually, 100 shares would produce approximately $105 per year in dividend income, split across four quarterly payments of roughly $26 each. Reinvesting this amount has a modest effect initially but compounds meaningfully over many years.
What does MarketBeat-style SCHD calculator data typically show?
Financial data sites generally display SCHD’s current yield, trailing dividend payments, ex-dividend dates, and historical growth rate, which are the same core inputs a standalone dividend calculator uses. Cross-referencing a few sources is useful since exact yield figures can vary slightly by the moment they’re calculated.
How much dividend income would 5,000 shares of SCHD generate?
At approximately $1.05 per share annually, 5,000 shares would generate around $5,250 per year in dividend income, or roughly $1,300 per quarter. At current share prices near $33.70, that position would represent an investment of approximately $168,500.
Also Read…