
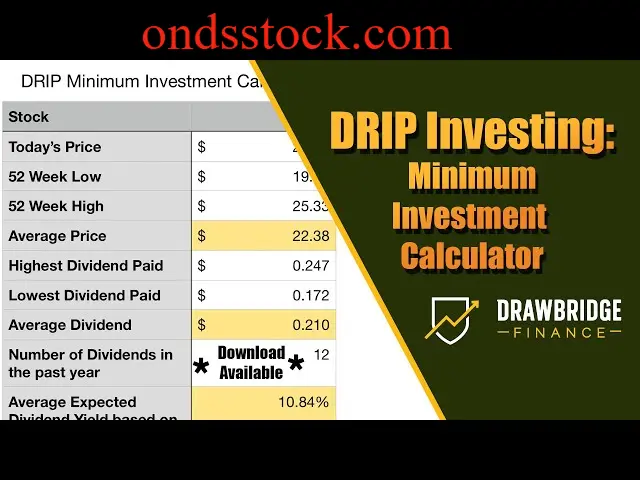
A DRIP calculator dividend tool answers a question every income investor eventually asks: if I let my dividends buy more shares instead of taking the cash, how much bigger does my portfolio actually get? The honest answer is that reinvestment barely moves the needle in year one or two — but over a decade or two, it can account for more of your total return than price appreciation alone. Here’s exactly how the math works, what inputs matter most, and how to use a calculator to get a realistic projection rather than a rough guess.
What Is DRIP (Dividend Reinvestment)?
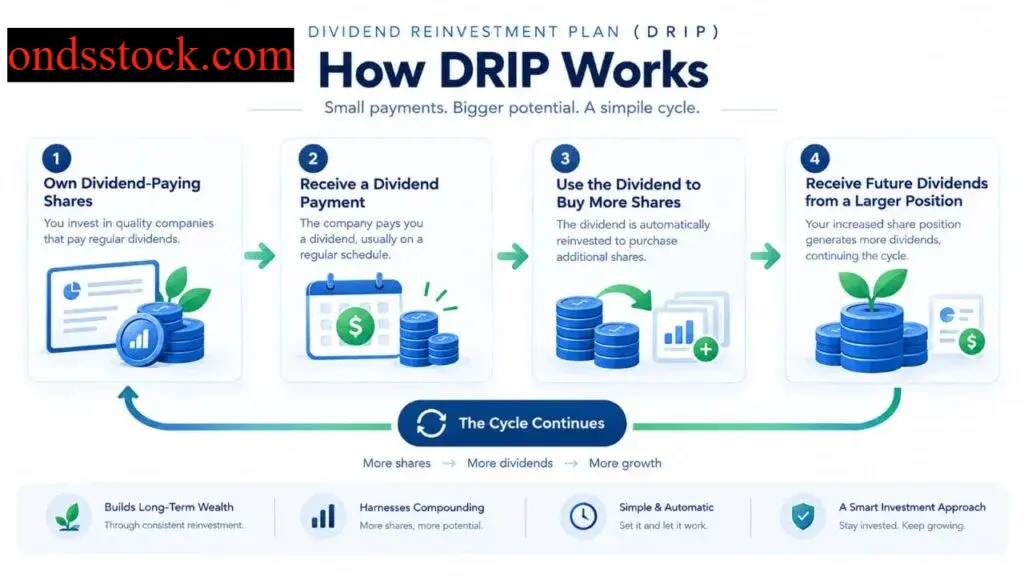
Short answer: DRIP stands for Dividend Reinvestment Plan — it automatically uses your cash dividends to purchase additional shares (including fractional shares at most modern brokers) instead of depositing that cash into your account.
Rather than receiving a quarterly or monthly dividend payment as spendable cash, a DRIP directs that payment straight back into buying more of the same stock or fund, at or near the current market price. Most major brokerages — including Fidelity, Charles Schwab, and Vanguard — offer this as a free, automatic account setting. Some companies also run their own DRIP programs directly through a transfer agent, occasionally at a small discount to market price.
The mechanism is simple, but its effect compounds:
- Your dividend buys additional shares.
- Those new shares generate their own dividends next payment cycle.
- Those dividends buy still more shares.
- The cycle repeats, so your share count — and therefore your income — grows even if you never add another dollar of your own money.
How Does Dividend Reinvestment Work, Step by Step?
- A dividend is declared — the company or fund announces a per-share payment and a payment date.
- Your position qualifies — you must own shares by the ex-dividend date to receive the payment.
- Cash is paid into your account — briefly, before reinvestment executes.
- The DRIP purchases shares — typically at the closing price on or near the payment date, including fractional shares.
- Your share count increases — even a $40 dividend can buy a full share plus a fraction, depending on the share price.
- The next dividend is calculated on the new, larger share count — which is the entire basis of compounding. dividendchannel.com
Key Inputs a Dividend Reinvestment Calculator Needs
A calculator is only as accurate as the assumptions you feed it. The core inputs used by most reliable DRIP calculator dividend tools are:
- Initial number of shares or starting principal — your entry point into the position.
- Initial price per share — used to convert a dollar amount into a share count.
- Initial dividend yield — the current annual yield at the time you invest.
- Annual dividend growth rate — how fast the per-share payout has historically increased, or your assumed future rate.
- Annual dividend yield growth — a related but distinct figure some calculators use to model yield expansion separately from raw dividend growth.
- Stock price annual growth rate — separate from dividend growth, this estimates capital appreciation.
- Dividends per year — monthly, quarterly, or annual, since payment frequency affects how quickly reinvestment compounds.
- Additional contribution and contribution frequency — new money added on top of reinvested dividends.
- Contribution growth — whether your contribution amount itself increases annually (common if you plan to save more as income rises).
- Number of years / time horizon — your total projection period.
- Dividend tax rate — relevant for taxable brokerage accounts, since qualified dividends are usually taxed at capital gains rates, not ordinary income rates.
- Maximum dividend yield — an optional cap some calculators apply so yield-on-cost projections don’t become unrealistic over very long horizons.
Calculator Results Explained: What the Numbers Actually Mean
A well-built calculator should output more than just an ending balance. Here’s what each result represents and why it matters:
| Output | What It Tells You |
|---|---|
| Ending balance / total portfolio value | Shares × ending price, including all reinvested dividends and contributions |
| Cumulative dividends | Total dollar amount of all dividends received (and reinvested) over the period |
| Annual dividend income | What your position would pay in dividends during the final year, based on ending share count and yield |
| Ending dividend yield / yield on cost | Final-year dividend income divided by your original invested amount — not the current price |
| Number of shares | How many total shares you’d own by the end, including those purchased entirely through reinvestment |
| Annualized return | Your compound annual growth rate across the full time horizon, combining price growth and dividend income |
The distinction between “current yield” and “yield on cost” trips up a lot of investors. Current yield is dividend income divided by today’s share price. Yield on cost is dividend income divided by what you originally paid — and with reinvestment plus dividend growth, that number can climb dramatically higher than the fund’s advertised yield over 10-20 years.
DRIP vs. No DRIP: Which Produces More Wealth?
Short answer: DRIP almost always produces a larger ending balance and higher future dividend income than taking dividends as cash, assuming the underlying investment doesn’t decline and dividends are reinvested at a reasonable price.
- With DRIP: Every payment buys more shares automatically. Your income grows in two ways simultaneously — from the company’s own dividend increases and from your rising share count.
- Without DRIP: Dividends are paid out as spendable cash. Your share count stays fixed unless you manually buy more, so income growth depends entirely on the company raising its payout.
DRIP isn’t automatically the right choice for everyone. Retirees drawing current income, or investors who need the cash flow for living expenses, often turn reinvestment off deliberately. The calculator’s job is to show you both paths side by side so the decision is based on numbers, not guesswork.
High Yield vs. High Growth: How the Math Actually Compares
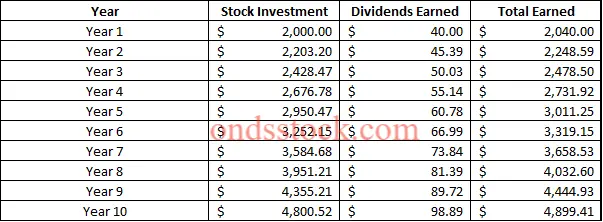
A common calculator experiment is comparing a high-yield, low-growth stock against a low-yield, high-growth stock. The results often surprise new investors.
- A higher starting yield with slow dividend growth tends to produce more income in the early years, which is attractive for near-term cash flow needs.
- A lower starting yield with faster dividend growth frequently overtakes the high-yield option in total income within 8-15 years, because compounding a faster growth rate eventually outpaces a larger but stagnant starting number.
Running both scenarios through the same calculator, using the same time horizon and contribution schedule, is the clearest way to see which approach actually fits your goals — income now, or income later.
What Are the Risks With Dividend Reinvestment?
DRIP isn’t risk-free, and a calculator’s clean output shouldn’t be mistaken for a guarantee. Real risks include:
- Dividend cuts — if a company reduces or suspends its payout, projected growth rates stop applying.
- Reinvesting into a declining stock — DRIP buys shares regardless of price, so a falling stock means you’re buying more of a losing position.
- Overconcentration — automatically reinvesting into a single stock or fund can unintentionally increase concentration risk over time.
- Tax complexity — in taxable accounts, reinvested dividends are still taxable income in the year received, even though you never touched the cash.
- Assumption sensitivity — small changes in your assumed growth rate compound dramatically over 20+ years, so overly optimistic inputs produce unrealistic projections.
Benefits of Dividend Reinvestment Plans
Despite the risks, DRIPs remain one of the most widely recommended long-term investing strategies because they:
- Automate compounding without requiring manual trades.
- Often avoid brokerage commissions on reinvested shares.
- Allow fractional share purchases, so no dividend cash sits idle.
- Remove the temptation to spend dividend income during accumulation years.
- Accelerate the “dividend snowball” — the point where reinvested income becomes a meaningful contributor to total portfolio growth.
Frequently Asked Questions
Is there a free DRIP calculator for dividends available online?
Yes, most brokerages and financial data sites offer free dividend reinvestment calculators. They cover the basics — ending balance, cumulative dividends, and income — though tax-rate or contribution-growth features may require a premium tool.
What does a simple dividend calculator actually calculate?
It estimates current dividend income from your share count, dividend per share, and payment frequency. It usually skips reinvestment and price growth, so it shows today’s income rather than a future projection.
How does a monthly dividend DRIP calculator work differently from a quarterly one?
It compounds reinvested shares 12 times a year instead of 4, so new shares start earning dividends sooner. The gap is small short-term but adds up over 15-20 years.
Is a weekly dividend DRIP calculator useful for most investors?
Not really — weekly payers are rare. This tool mainly suits niche income funds, since most stocks and ETFs pay quarterly or monthly.
Can I look up a stock dividend calculator by ticker symbol?
Yes, many calculators auto-pull price, yield, and dividend history from a ticker. It’s convenient, but worth double-checking against the company’s official investor relations page for accuracy.
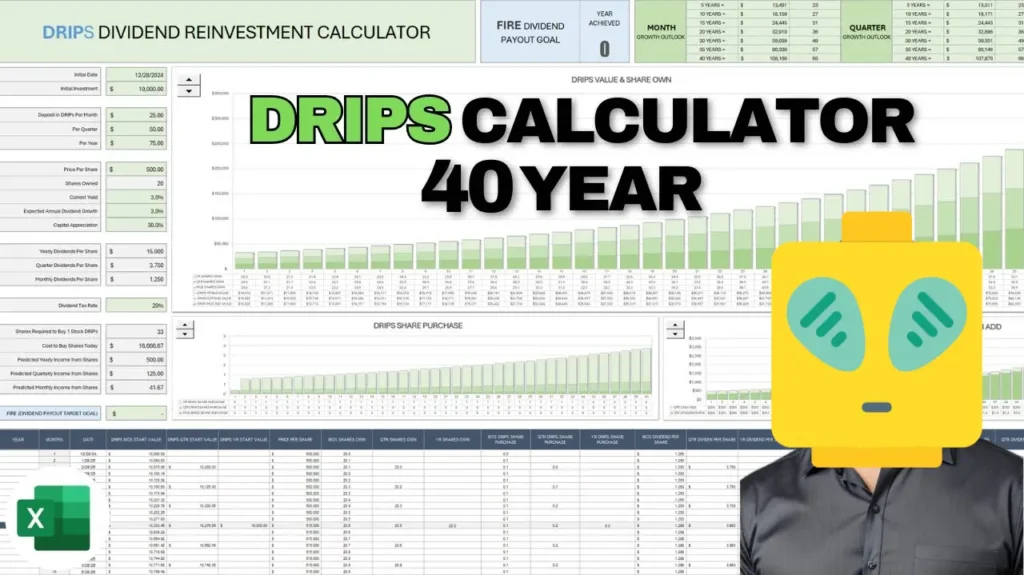
Is there a reliable dividend reinvestment calculator in Excel format?
Yes, and Excel gives you full control to audit every formula. It takes more setup time than an online calculator but handles custom scenarios better.
Also Read…