
Most investors end up choosing sides. You either chase fast-growing companies and accept sky-high valuations, or you hunt for cheap stocks and risk buying businesses that deserve to be cheap. Neither extreme is particularly comfortable. Growth at a Reasonable Price — GARP — offers a third path, and a dedicated GARP ETF now makes it easier than ever to follow it.
This guide explains exactly what the GARP investing approach involves, how the index that powers the leading GARP ETF actually screens for stocks, what you own when you buy it, and how the fund has performed over time. Whether you’re comparing it to other ETFs or just trying to understand what you’re looking at, you’ll find clear and honest answers here.
What Is the GARP Strategy and Why Does It Matter?
GARP stands for Growth at a Reasonable Price. It’s an equity strategy that targets companies with above-average earnings growth but filters out those trading at valuations too rich to justify the growth on offer. In short, it refuses to pay up for growth unless the price makes sense.
The idea has roots going back to legendary investors like Peter Lynch, who famously argued that a company’s P/E ratio should never stray too far above its earnings growth rate. GARP investing sits deliberately between pure growth and pure value. It doesn’t chase the fastest-growing companies regardless of price, and it doesn’t buy statistically cheap stocks regardless of quality. Instead, it applies valuation discipline to a universe of genuine growth candidates. For investors frustrated by the all-or-nothing binary of growth versus value, it’s a practical middle ground with a real track record.
How Does a GARP ETF Screen Stocks?
The dominant GARP ETF in the US market is the iShares MSCI USA Quality GARP ETF, which trades under the ticker GARP on the Cboe exchange. Understanding how it selects stocks tells you a great deal about what you’re actually buying.
<cite index=”15-1″>The fund begins its selection process with the MSCI USA Index, which covers large- and mid-cap U.S. equities. Each stock receives a growth score based on five criteria: long-term and short-term forward EPS growth rates, historical EPS and sales per share growth trends, and the current internal growth rate. Stocks with higher growth scores are selected until they represent approximately 50% of the parent index.</cite>
That growth screen is only the first filter. <cite index=”15-1″>Each stock then receives a tilt score, which factors in value metrics — price-to-book, forward P/E, and enterprise value to operating cash flow — alongside quality metrics including return on equity, debt-to-equity ratio, and earnings variability. The portfolio is then weighted toward securities that score favorably on both the value and quality dimensions, with adjustments made for portfolio diversification. The index rebalances quarterly.</cite>
This two-stage process is what separates a GARP fund from a simple growth fund. You’re not just buying fast growers. You’re buying fast growers that also score well on balance sheet quality and reasonable valuation. That combination does real filtering work. digital.fidelity.com
The PEG Ratio: GARP’s Classic Measuring Stick
Before ETFs made GARP accessible to everyone, individual investors applying this strategy relied heavily on the PEG ratio — price-to-earnings divided by the earnings growth rate. A PEG ratio below 1.0 has traditionally been interpreted as a signal that a company’s growth isn’t fully reflected in its price, while a ratio well above 1.0 suggests the market may already be pricing in optimistic expectations.
The PEG ratio is a useful first filter, but it has real limitations worth understanding. It depends heavily on the accuracy of forward earnings estimates, which can be wrong — sometimes very wrong. A company with a low PEG based on inflated growth forecasts can turn into a trap once growth disappoints. The MSCI GARP index addresses this partly by incorporating historical growth trends alongside forward estimates, which smooths out some of the noise from overly optimistic analyst projections. It also layers in quality metrics that a plain PEG ratio ignores entirely, such as return on equity and debt levels. Thinking of GARP purely through the lens of PEG is a starting point, not the whole picture.
iShares MSCI USA Quality GARP ETF: Key Facts and Performance
This is the fund most US investors mean when they search for a GARP ETF. Here’s a clear snapshot of what it looks like today.
| Metric | Data |
|---|---|
| Ticker | GARP (Cboe) |
| Issuer | BlackRock / iShares |
| Inception Date | January 14, 2020 |
| Index Tracked | MSCI USA Quality GARP Select Index |
| Expense Ratio | 0.15% |
| Number of Holdings | ~135 |
| AUM | ~$1.27 billion (USD) |
| Morningstar Rating | 5 Stars (Overall) |
| Morningstar Medalist Rating | Gold Medal |
| Dividend Yield | ~0.27% |
| Rebalancing | Quarterly |
<cite index=”3-1″>Before June 3, 2024, the fund was named the iShares Factors US Growth Style ETF under the ticker STLG and tracked the Russell US Large Cap Factors Growth Style Index.</cite> The rename to GARP and the shift to the MSCI index reflected a deliberate repositioning to more explicitly communicate the fund’s dual focus on growth and valuation quality.
Performance Numbers
<cite index=”20-1″>The fund’s 1-year total return stands at 37.25%, while the 3-year annualized return is 31.49% and the 5-year annualized return is 19.14%, as of data reported through mid-2026.</cite> Those are strong numbers by any reasonable measure, and they’ve been achieved with a disciplined valuation filter in place — not by simply piling into the highest-multiple growth names.
<cite index=”2-1″>Morningstar has awarded the fund a Gold medal, its highest level of conviction, and a 5-star overall rating based on risk-adjusted total return against nearly 1,000 large growth funds.</cite> That combination of top-tier performance ratings and a rock-bottom 0.15% expense ratio makes it one of the more compelling factor ETFs on the market for US investors.
Top Holdings
<cite index=”26-1″>The fund’s top holdings include Microsoft at approximately 5.29%, Micron Technology at 4.84%, NVIDIA at 4.54%, Apple at 4.54%, and KLA Corporation at 4.34%. The top 10 holdings account for roughly 42% of total assets.</cite>
<cite index=”21-1″>Information technology accounts for more than half of the fund’s sector exposure, which creates meaningful concentration risk if that sector faces a prolonged downturn. The fund’s heavy focus on US companies also limits international diversification.</cite> These are real trade-offs worth weighing — especially for investors already overweight US tech through index funds.
GARP vs. Pure Growth vs. Pure Value: What’s the Practical Difference?
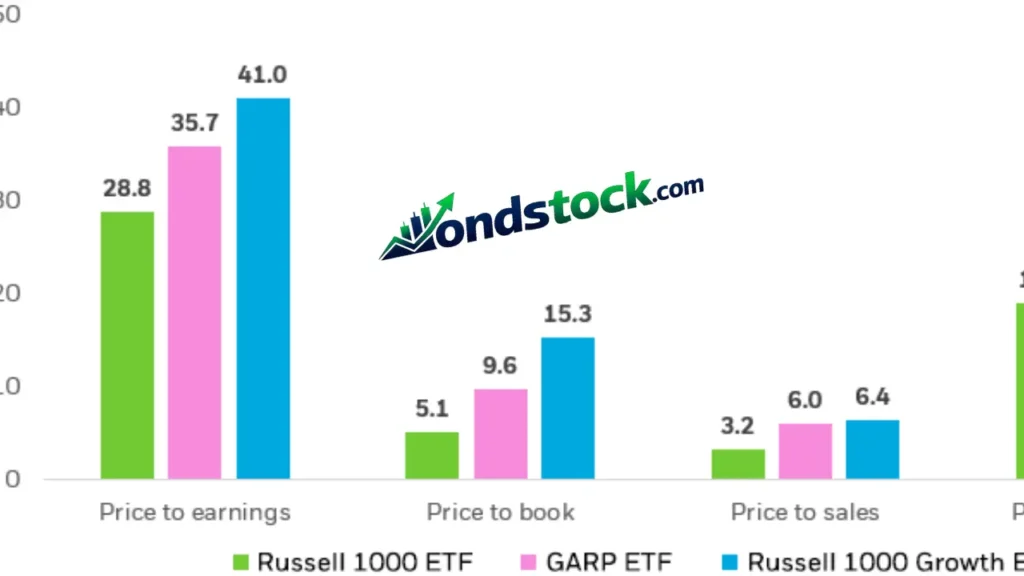
Investors often ask how a GARP ETF actually behaves differently from a standard growth fund or a value fund. The table below makes the comparison straightforward.
| Dimension | Pure Growth ETF | GARP ETF | Pure Value ETF |
|---|---|---|---|
| Primary Focus | High earnings growth rate | Growth + reasonable valuation | Low price multiples |
| Valuation Tolerance | High (accepts rich multiples) | Moderate (valuation disciplined) | Low (seeks cheap stocks) |
| Quality Filter | Often minimal | ROE, debt, earnings variability | Often minimal |
| Downside Risk | High in rate-rising markets | Moderate | Can include value traps |
| Best Environment | Falling rates, risk-on | Most market environments | Recovering or defensive markets |
| PEG Sensitivity | Low | High | Low |
The GARP approach tends to hold up better than pure growth during market corrections driven by multiple contraction, because it was never paying the highest valuations to begin with. It also tends to outperform pure value during sustained economic expansion, because it holds companies with genuine earnings momentum rather than statistically cheap businesses without growth drivers. No strategy wins in every environment, but GARP’s dual filter gives it resilience across more market cycles than either extreme.
What About a Vanguard GARP ETF?
This is a question that comes up frequently, and the honest answer is: Vanguard does not currently offer a dedicated GARP ETF. Vanguard’s factor lineup focuses on quality, value, dividend, and minimum volatility strategies. Its closest adjacent products — the Vanguard U.S. Quality Factor ETF (VFQY) or the Vanguard Growth ETF (VUG) — overlap with GARP themes but don’t apply the same combined growth, value, and quality screen that the MSCI methodology uses.
If you’re a Vanguard-first investor, the closest single-fund approximation would be pairing a growth ETF with a quality screen overlay, but you won’t find a product that does what the iShares GARP ETF does in one ticker within Vanguard’s current lineup. That may change — factor-based products have been expanding across all major issuers — but as of late 2024, iShares holds the most direct product in this space for US investors.
What Are the Real Risks of GARP Investing?
GARP investing carries real risks that investors should understand before buying. The strategy sounds elegant in theory, but a few practical pitfalls deserve honest attention.
The first is forward earnings accuracy. The GARP screen relies partly on expected EPS growth, and analyst earnings forecasts are notoriously imprecise over longer time horizons. A company that looks attractively priced relative to its growth forecast can look expensive quickly if those estimates are revised lower. The second risk is sector concentration. The current GARP ETF holds more than half its weight in technology, which means it doesn’t behave like a broadly diversified equity fund. A sector-specific shock would hit this fund harder than a plain S&P 500 index fund. Third, GARP’s quality filter may exclude genuine deep-value opportunities — companies going through temporary difficulty that would actually recover. It’s not designed to fish in those waters, and that’s a deliberate trade-off, not an oversight.
Who Should Consider a GARP ETF?
The GARP ETF works best for investors with a few specific characteristics. You believe in the long-term earnings power of quality US businesses, but you’re uncomfortable paying the kind of multiples that pure growth ETFs carry. You want a rules-based, systematic approach — not an active manager’s discretionary picks. And you want a low-cost fund with transparent quarterly rebalancing and a clear methodology you can evaluate.
It’s less suited for investors who want maximum geographic diversification, who are deliberately seeking cheap deep-value exposure, or who prefer minimal technology concentration. Understanding what you’re buying — and what it isn’t — is the most important part of evaluating any ETF.
Frequently Asked Questions
What is the iShares GARP ETF? <cite index=”1-1″>The iShares MSCI USA Quality GARP ETF seeks to track an index of U.S. growth stocks with favorable value and quality characteristics. It offers a way to invest in growth companies at reasonable prices for potential long-term portfolio appreciation.</cite>
Is there a Vanguard GARP ETF? No. Vanguard does not currently offer a dedicated GARP ETF. The iShares MSCI USA Quality GARP ETF, ticker GARP, is the primary US-listed fund explicitly built around the GARP strategy.
What is the MSCI GARP ETF? <cite index=”8-1″>The MSCI USA Quality GARP Select Index is the underlying benchmark for the iShares GARP ETF. It is a subset of the broader MSCI USA Index and is designed to identify securities exhibiting stronger growth characteristics, weighted for relatively favorable value and quality traits.</cite>
What are the GARP ETF’s top holdings? <cite index=”26-1″>The fund’s largest positions include Microsoft (5.29%), Micron Technology (4.84%), NVIDIA (4.54%), Apple (4.54%), and KLA Corporation (4.34%), with the top 10 holdings making up roughly 42% of total assets.</cite>
What does the MSCI USA Quality GARP ETF actually invest in? <cite index=”6-1″>It is a passively managed U.S. equity large growth ETF that tracks the MSCI USA Quality GARP Select Index, covering large- and mid-capitalization U.S. stocks, with a small allocation to foreign-listed securities.</cite>
What is the GARP ETF’s expense ratio? <cite index=”3-1″>The GARP ETF carries an expense ratio of 0.15%.</cite> That is competitive among factor-based ETFs and meaningfully cheaper than most active funds pursuing similar objectives.
How can I read the GARP ETF chart? The GARP ETF trades on the Cboe exchange under the ticker GARP. You can view its price chart, NAV history, and fund flows on platforms like TradingView, Morningstar, or directly on BlackRock’s iShares website at ishares.com. <cite index=”20-1″>As of mid-2026, the fund’s 52-week range runs from $61.55 to $85.65, with a year-to-date NAV total return of approximately 25.63%.
Read More…