

If you’ve been searching for monthly income from energy markets, PVL stock has probably crossed your radar. Permianville Royalty Trust sits in a niche corner of the market — oil and gas royalty trusts — that attracts income-focused investors but confuses everyone else. The structure is unusual. The risk profile is specific. And the distributions can swing dramatically from one month to the next.
This guide gives you a complete, honest picture of what PVL actually is, how its distributions work, what the 2024 financials tell you, and what you realistically need to understand before deciding whether it belongs in your portfolio.
What Is Permianville Royalty Trust?
Permianville Royalty Trust is a Delaware statutory trust, not an operating company. It doesn’t drill wells, employ engineers, or make strategic decisions. Its entire purpose is to collect royalty income from existing oil and natural gas production and pass that income to unitholders each month.
<cite index=”29-1″>The trust owns an 80% net profits interest (NPI) representing the right to receive 80% of the net profits from the sale of oil and natural gas production from predominantly non-operated properties in Texas, Louisiana, and New Mexico. The underlying properties are divided into the Permian Basin region — covering conventional and unconventional assets — and the East Texas/North Louisiana region, which encompasses the Haynesville basin.
<cite index=”29-1″>The trust was founded in 2011 as Enduro Royalty Trust and renamed Permianville Royalty Trust in September 2018 following its acquisition by COERT Holdings 1 LLC, which serves as the current sponsor. The Bank of New York Mellon Trust Company, N.A. acts as trustee, with Argent Trust Company serving as an overseeing entity. The trust is headquartered at 601 Travis Street, Houston, Texas.
The NPI structure is the single most important concept to understand. The trust receives 80 cents of every dollar of net profit — after operating costs and capital expenditures — from the underlying properties. When commodity prices fall or operator costs rise, those net profits can shrink to almost nothing. When energy prices are strong and costs stay in check, the distributions flow generously.
PVL Stock Price History and Performance

Permianville Royalty Trust trades on the New York Stock Exchange under the ticker PVL. Its price history reflects both the volatility of oil and natural gas markets and the specific challenges this trust has faced in recent years.
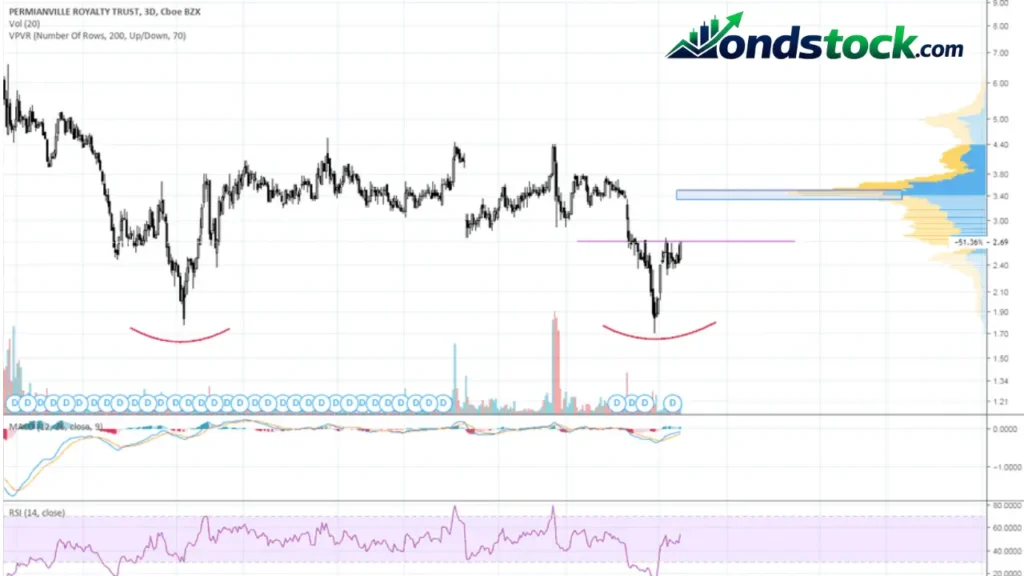
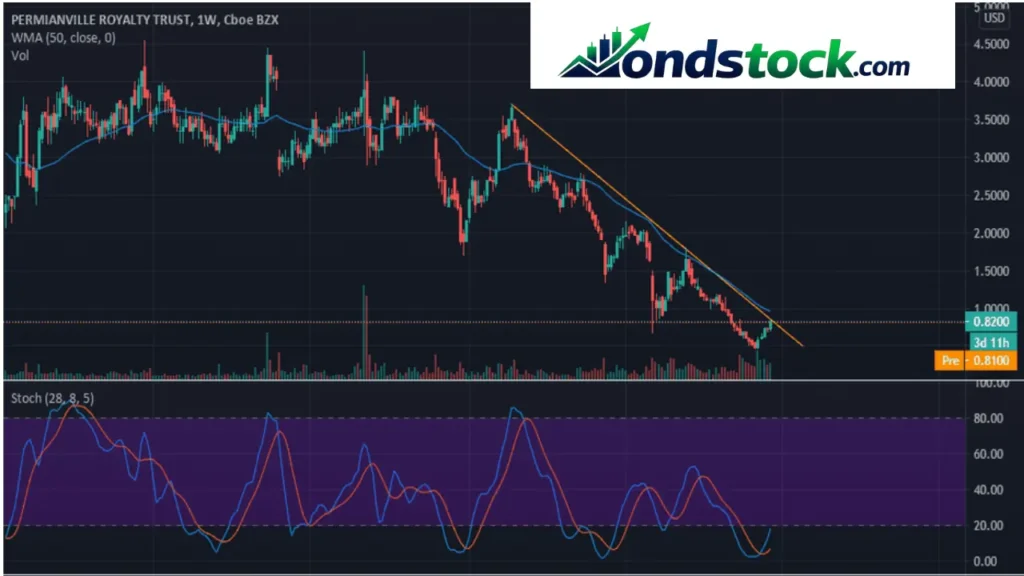
Looking at recent monthly price history, PVL traded as low as $1.22 in December 2024, recovered to a range of $1.44–$1.62 through early 2025, and climbed to a high of around $1.98 in August 2025 before settling back near $1.73–$1.80 through mid-2026.
As of December 2025, the trust’s 52-week price range ran from a low of $1.30 to a high of $2.04, with a market capitalization of approximately $60 million.</cite> That’s a small-cap vehicle with thin average daily trading volume — typically around 40,000 to 85,000 shares. Liquidity is limited compared to larger energy stocks, and bid-ask spreads can widen during low-volume sessions. Investors buying meaningful position sizes should be aware that getting in and out quickly isn’t always practical.
Key Financial Metrics at a Glance
| Metric | 2024 | 2023 | 2022 |
|---|---|---|---|
| Total NPI Income | $4.26M | $10.35M | N/A |
| Total Revenue (gross) | $4.3M | $10.4M (est.) | Higher |
| Net Income | ~$2.8M | ~$14.1M | Higher |
| Distributable Income | $2.82M | $14.11M | Higher |
| Distributions per Unit | $0.0855 | $0.42767 | Higher |
| Market Cap (late 2025) | ~$60M | — | — |
| P/E Ratio (TTM) | ~13–29x | Varies | — |
| Dividend Yield | ~6–12% | Higher | — |
<cite index=”39-1″>The trust’s 2024 annual report, filed for the fiscal year ended December 31, 2024, showed total income from the net profits interest of $4,259,281, compared to $10,347,619 the prior year. The Trust reported oil sales of $50,291,248 and natural gas sales of $11,341,855 from the underlying properties. However, total direct operating expenses were $26,801,000, and development expenses were $20,345,000 — leaving distributable income for 2024 of just $2,821,500, down sharply from $14,113,110 in 2023.</cite>
That compression in net income is the central story of 2024. Gross revenues from the underlying properties were substantial, but the NPI structure means PVL only captures 80% of net profits after all those operating and development costs. When operator spending rose alongside softer commodity prices, the trust’s take shrunk considerably.
How the 80% Net Profits Interest Actually Works
Understanding the NPI is essential to evaluating this trust honestly.
The trust doesn’t receive a percentage of gross revenues. It receives 80% of net profits, which means 80% of what’s left after the working interest owners deduct operating expenses, capital expenditures, production taxes, and other costs. Here’s the practical implication:
- In a high-price, low-cost environment: Net profits are large, distributions flow generously.
- In a low-price or high-development-cost environment: Net profits can approach zero, and distributions can be suspended entirely.
- There is no guaranteed minimum distribution. The trust has suspended distributions in the past when net profits turned negative.
<cite index=”40-1″>The trust reinstated monthly distributions in late 2024 after a suspension earlier that year due to net profit shortfalls amid low commodity prices and high costs. Oil production volumes increased 45% in fiscal 2024 from new Permian wells, while gas volumes rose 8%.</cite> That production growth is a meaningful positive development — but it hasn’t yet translated into consistent, predictable distributions because cost structures remain elevated.
PVL Dividend History and Distribution Trends
Permianville Royalty Trust pays monthly distributions rather than quarterly dividends. The distribution amount changes every month based on the NPI calculation from the prior period’s production, prices, and costs.
<cite index=”31-1″>Recent monthly distributions have been volatile. In 2025 and into 2026, payments ranged from a low of $0.0050 per unit (March 2026) to $0.0300 per unit (October 2025), with the most recent distribution as of July 2026 at $0.0170 per unit. Prior year comparisons show distributions of $0.0105 per unit in November 2024.
For context on the trust’s longer arc: in 2023, unitholders received $0.42767 per unit for the full year. In 2024, that dropped to just $0.0855 per unit. That’s an 80% year-over-year reduction in total annual distributions — a jarring cut that illustrates exactly how commodity-driven this income stream is.
<cite index=”38-1″>The trust’s average dividend frequency is monthly, and it has been paying distributions for 16 years. However, its 3-year dividend growth rate is approximately negative 5.55%, reflecting recent distribution cuts. dividendmax.com
What drives distribution cuts?
- Declining WTI crude prices squeeze net profits directly
- Rising operator capital expenditures reduce the NPI calculation
- Production declines from aging wells require more expensive intervention
- The trust has no ability to reinvest capital or offset costs independently
Production Outlook: The Core Long-Term Question
Every royalty trust faces the same structural reality: the underlying production base depletes over time. New wells can temporarily boost output, but a finite-life trust built on legacy assets is ultimately working against a declining production curve.
<cite index=”39-1″>The trust’s net profits interest in oil and natural gas properties was valued at $41,892,402 as of December 31, 2024, with accumulated amortization of $311,034,905.</cite> That accumulated amortization figure — more than seven times the current net carrying value — is a striking indicator of how far the production base has already been depleted since the trust’s formation.
The 45% increase in oil production from new Permian wells in 2024 is an encouraging development. The Permian Basin remains one of the most productive and actively developed oil basins in the world, and the Haynesville basin has benefited from increased LNG export demand driving natural gas prices. However, that operator activity is driven by COERT Holdings’ discretionary capital decisions — and PVL unitholders have no control over how much or how little the operator invests.
Is PVL Stock Undervalued or Overvalued?
Valuing a royalty trust requires a different framework than valuing a growth stock. There’s no revenue growth to project, no R&D spending to evaluate, and no competitive positioning to analyze. What you’re really buying is a yield on a declining, commodity-sensitive asset stream.
The relevant question is: at the current price, is the distributable income stream worth what you’re paying?
<cite index=”38-1″>At recent prices, PVL carries a P/E ratio of approximately 13x on a trailing basis, an earnings per share figure near $0.15, and a forward dividend yield ranging from approximately 10 to 12% depending on commodity assumptions.</cite>
A double-digit yield sounds attractive, but the critical question is whether that yield is sustainable. Given the distribution cuts of 2024, the answer depends heavily on where WTI crude and Henry Hub natural gas prices settle, and how aggressively the operator continues developing the Permian acreage.
<cite index=”37-1″>The dividend payout ratio for PVL sits near 88.89%, which is above the 75% threshold typically considered sustainable for income-generating securities. The trust’s dividend yield puts it in the top 25% of dividend-paying stocks — but the dividend itself doesn’t have a strong growth track record.
PVL Compared to Peer Royalty Trusts
There are several US-listed oil and gas royalty trusts investors often compare to PVL. Here’s how they stack up on the most relevant dimensions.
| Trust | Ticker | Market Cap | Yield (Approx.) | Basin Focus | NPI Structure |
|---|---|---|---|---|---|
| Permianville Royalty Trust | PVL | ~$57M | 8–12% | Permian + Haynesville | 80% NPI |
| San Juan Basin Royalty Trust | SJT | ~$134–200M | Varies | San Juan Basin, NM | 75% net royalty |
| PermRock Royalty Trust | PRT | ~$48M | Variable | Permian Basin | Net profits |
| Cross Timbers Royalty Trust | CRT | ~$46M | ~10% | Texas, OK, NM | Royalty interests |
| VOC Energy Trust | VOC | ~$49M | ~14% | Kansas | 80% NPI |
PRT Stock (PermRock Royalty Trust)
PermRock Royalty Trust (NYSE: PRT) is one of PVL’s closest structural peers, with a focus on Permian Basin properties and a similar net profits interest structure. <cite index=”49-1″>PermRock trades at approximately $3.88 with a market cap near $47.6 million and a P/E ratio of 8.88.</cite> It offers more pure-play Permian exposure than PVL, though it carries similar commodity sensitivity and operator-dependency risks.
SJT Stock (San Juan Basin Royalty Trust)
San Juan Basin Royalty Trust (NYSE: SJT) is one of the oldest US royalty trusts, focused on natural gas production from the San Juan Basin in northwestern New Mexico. <cite index=”57-1″>About 98% of San Juan’s royalties come from natural gas, making it far more exposed to Henry Hub price movements than to WTI crude.</cite> <cite index=”52-1″>The trust was incorporated in 1980 and has a 75% net overriding royalty interest across approximately 119,000 net-producing acres in New Mexico.</cite> SJT’s larger market cap — roughly $134 to $200 million depending on the period — reflects a deeper and more established production base, though it faces the same depletion pressures as all finite-life trusts.
Key Risks Every PVL Investor Should Understand
PVL is not a diversified income investment. It is a concentrated, commodity-linked, passively structured royalty interest in a depleting asset base. That combination creates specific risks:
- Distribution volatility — Monthly payouts can fall to near zero or be suspended entirely when commodity prices weaken or operator costs surge, as happened in mid-2024.
- No management control — Unitholders cannot influence operator spending, asset maintenance, or development decisions.
- Asset depletion — The underlying properties will produce less over time, reducing the long-term income potential.
- Operator dependency — <cite index=”39-1″>The trust’s operations are wholly dependent on the financial condition of COERT Holdings 1 LLC, which controls the underlying property operations. Financial distress at the operator level would directly impact distributions.</cite>
- Low liquidity — Average trading volume is thin, which can make entering and exiting positions at desired prices difficult.
- Commodity price sensitivity — WTI crude and Henry Hub natural gas prices directly determine distributable cash flow with no hedging protection at the trust level.
Frequently Asked Questions
What is the PVL stock dividend?
The most recent distribution was $0.0170 per unit, paid July 15, 2026, for the month of June 2026. PVL pays monthly distributions that fluctuate based on the net profits interest calculation each period.
What is the latest PVL stock news?
The most significant recent development is the reinstatement of monthly distributions in late 2024, following a suspension earlier in the year due to net profit shortfalls.
What is PVL’s current stock price?
PVL traded at approximately $1.69 to $1.87 throughout mid-2026, with a July 2026 adjusted price of $1.73. The 52-week price range (as of late 2025) extended from $1.30 to $2.04.
What does PVL’s dividend history look like?
PVL’s dividend history shows significant variability. Distributions ran from $0.0085 to $0.0300 per unit on a monthly basis through 2025 and into 2026.
What is the PVL stock forecast?
No Wall Street analyst currently covers PVL with formal price targets or earnings estimates.
What is PRT stock?
PRT is the ticker for PermRock Royalty Trust, a Permian Basin-focused royalty trust listed on the NYSE.
What is SJT stock?
SJT is San Juan Basin Royalty Trust, one of the oldest US royalty trusts, formed in 1980.
Read More…