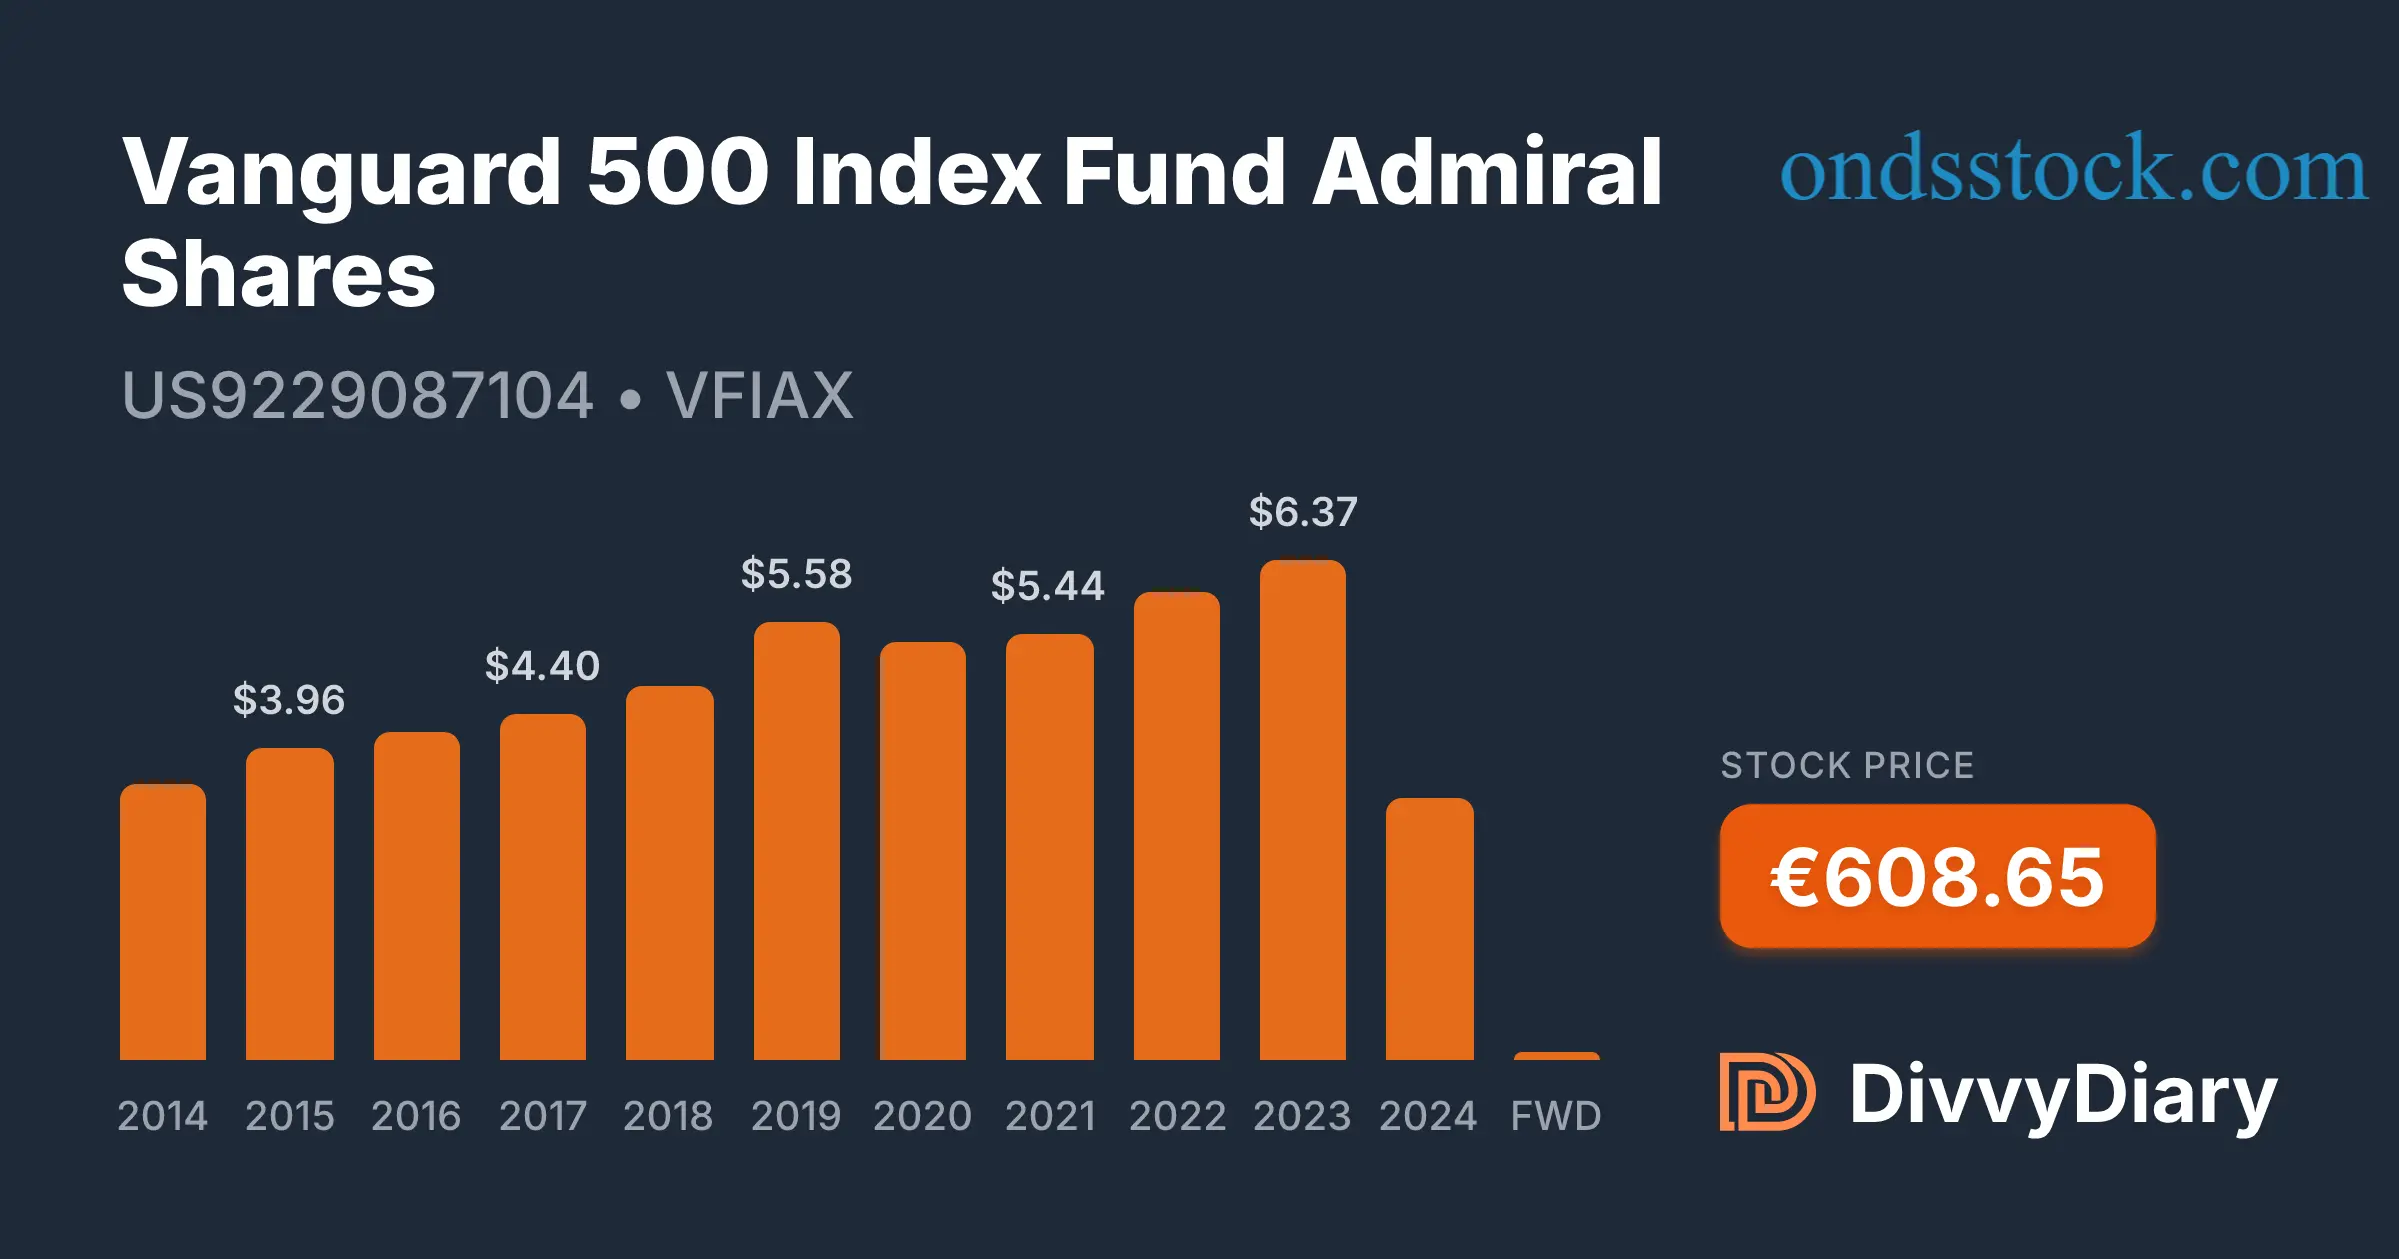
If you are searching for the VFIAX stock price today, the first thing to know is that VFIAX is technically a mutual fund, not an individual stock. Its ticker is VFIAX, and its full name is Vanguard 500 Index Fund Admiral Shares.
As of September 17, 2026, the latest verified closing NAV available is $698.46 per share from September 16, 2026, down $3.11, or 0.44%, for that session. The September 17 closing NAV was not yet available in the latest verified data.
VFIAX is designed to track the S&P 500 Index, giving investors exposure to large U.S. companies through a single mutual fund. Vanguard lists the fund with a 0.04% expense ratio and a $3,000 minimum investment.
Latest verified VFIAX price: $698.46
Date: September 16, 2026
Daily change: -$3.11 (-0.44%)
Fund: Vanguard 500 Index Fund Admiral Shares
Benchmark: S&P 500 Index
Expense ratio: 0.04%
Minimum investment: $3,000
How VFIAX Works
VFIAX uses a passive indexing strategy rather than trying to select stocks that a manager expects to outperform the market.
Passive Index Tracking
The fund seeks to track the S&P 500 Index, which is a market-capitalization-weighted index containing 500 of the largest publicly traded U.S. companies.
Vanguard explains that VFIAX holds shares of the companies represented in the S&P 500 and seeks to maintain approximately the same weighting as the underlying index.
This means VFIAX performance is primarily driven by movements in the companies and sectors represented in the S&P 500.
Market Cap Weighting in Practice
Market-cap weighting means larger companies generally have greater influence on the index.
For example, if a company represents a larger percentage of the S&P 500, VFIAX generally assigns a similar weight to that company. This gives the portfolio broad exposure but also means the largest companies can have a significant effect on overall fund performance.
Dividend Handling
VFIAX receives dividends from the companies it owns and distributes income to shareholders according to the fund’s distribution schedule.
Vanguard’s 2026 distribution calendar lists VFIAX’s March 2026 record date as March 26, reinvestment/ex-dividend date as March 27, and payable date as March 30. advisors.vanguard.com
What Type of Stocks Are in VFIAX?
VFIAX is focused on large-cap U.S. equities rather than bonds or a broad mix of global asset classes.
Large-Cap Focus
The fund’s objective is to provide exposure to large-capitalization stocks through the S&P 500.
This makes VFIAX different from a total-market fund that also includes thousands of smaller companies.
Sector Exposure Today
Because the S&P 500 is market-cap weighted, sector exposure changes as the market values of companies change.
Technology, financials, health care, consumer companies, communication services, industrials, energy, and other sectors are represented through the index.
The important point is that VFIAX is not equally weighted across sectors or individual companies. Its allocation follows the structure of the benchmark.
VFIAX Expense Ratio and Cost Efficiency
One of the major characteristics of VFIAX is its low expense ratio.
Vanguard currently lists the VFIAX expense ratio at 0.04%.
An expense ratio represents the annual operating expenses charged against a fund’s assets. Although 0.04% is small, costs can matter over long investment periods because they reduce the portion of returns that remains invested.
Vanguard says its Admiral Shares generally combine relatively low expense ratios with lower investment minimums, with most index-fund Admiral Shares requiring $3,000.
VFIAX Performance and Fees
Recent performance naturally changes as the S&P 500 moves.
Vanguard’s published fund listing showed VFIAX with average annual returns of 13.48% for the year-to-date period, 19.52% over one year, 12.81% over five years, and 15.04% over 10 years, with those return figures listed as of July 31, 2026. These figures are historical and should not be interpreted as forecasts.
Third-party market data showed a $698.46 September 16, 2026 close and a 52-week range of approximately $585.37 to $720.28.
The difference between a daily NAV and a total return is important. Total return can include both changes in fund value and distributions, while the displayed NAV represents the fund’s per-share net asset value.
What Drives VFIAX Performance?
VFIAX performance is primarily connected to the performance of the S&P 500 and the companies within it.
Important factors include:
- Earnings growth among large U.S. companies
- Changes in stock valuations
- Interest-rate expectations
- Corporate profits
- Economic growth
- Investor sentiment
- Sector performance
- Dividend income
- Changes in the market capitalization of major holdings
Because VFIAX follows an index, it does not attempt to move into cash simply because a fund manager expects a market decline.
VFIAX vs Alternatives
Several funds provide similar or broader exposure, but their structures are different.
| Feature | VFIAX | VOO | VTSAX |
|---|---|---|---|
| Structure | Mutual fund | ETF | Mutual fund |
| Main exposure | S&P 500 | S&P 500 | Total U.S. stock market |
| Investment approach | Passive | Passive | Passive |
| Large-cap exposure | Yes | Yes | Yes |
| Mid/small-cap exposure | Limited through index | Limited through index | Yes |
| Intraday trading | No | Yes | No |
| Minimum for VFIAX/VTSAX | $3,000 | ETF market price | $3,000 |
VFIAX vs VOO
VFIAX and VOO both provide exposure to the S&P 500, but VFIAX is a mutual fund while VOO is an exchange-traded fund.
That structural difference affects how investors transact. VOO trades throughout the market day, while a mutual fund such as VFIAX is priced using its NAV.
VFIAX vs VTSAX
VTSAX tracks the broader U.S. stock market rather than specifically targeting the S&P 500.
Vanguard describes its total-market strategy as providing exposure to thousands of U.S. stocks, including companies beyond the large-cap segment.
Therefore, the main distinction is S&P 500 exposure versus broader U.S. equity exposure.
The Tax Efficiency Factor
VFIAX’s passive structure can help reduce unnecessary portfolio turnover.
The latest available data shows a turnover rate of approximately 2%, meaning the portfolio generally does not replace a large portion of its holdings every year.
Lower turnover can reduce trading activity and may support tax efficiency, although an investor’s actual tax results depend on distributions, account type, purchase price, holding period, and individual tax circumstances.
The Concentration Paradox
VFIAX provides exposure to hundreds of companies, but that does not mean every company has an equal impact.
Broad but Narrow
The fund is broad because it contains many companies across different industries.
At the same time, its market-cap weighting means the largest companies can account for a substantial portion of the portfolio.
This is an important distinction when examining VFIAX holdings.
What It Means for Investors
Someone looking at VFIAX should understand both sides:
- It provides diversified exposure across major U.S. companies.
- It remains heavily connected to large-cap U.S. equities.
- Its largest holdings can materially affect returns.
- It does not provide the same small-cap exposure as a total-market fund.
How VFIAX Fits Into a Portfolio
VFIAX is often used as a core U.S. equity holding because it provides exposure to the S&P 500 through one fund.
Core Holding
A core holding is generally intended to provide broad exposure rather than focus on one company or narrow industry.
VFIAX can serve that function for investors seeking large-cap U.S. equity exposure, although whether it fits a particular portfolio depends on the investor’s objectives, risk tolerance, time horizon, and other investments.
Regular Investing
Regular contributions can provide a systematic way to build an investment position.
The key distinction is that VFIAX does not eliminate market risk. Its value can rise or fall with the underlying equity market.
Long-Term Perspective
The fund’s historical returns show why investors often examine VFIAX over multiple years rather than focusing only on one day’s price.
However, historical performance does not guarantee future results.
When VFIAX Performs Well
VFIAX generally benefits when the large U.S. companies represented in the S&P 500 experience rising share prices and strong earnings expectations.
Favorable Conditions
Periods featuring strong corporate earnings, economic expansion, improving investor sentiment, or rising valuations can support large-cap equity performance.
More Difficult Periods
VFIAX can also decline during market corrections, recessions, periods of falling corporate earnings, or sharp valuation adjustments.
There is no mechanism within the passive strategy that guarantees protection during a market decline.
Limitations of VFIAX
Before considering VFIAX, it is useful to understand its limitations.
Market risk: VFIAX is an equity fund and can lose value.
Large-cap concentration: The fund focuses on the largest U.S. companies rather than the entire global stock market.
No intraday pricing: Unlike an ETF, VFIAX does not trade continuously throughout the day.
S&P 500 dependence: Its performance is closely tied to one major U.S. equity benchmark.
Minimum investment: Vanguard currently lists a $3,000 minimum for VFIAX.
No guaranteed return: Past performance cannot predict future results.
Vanguard 500 Index Admiral Overview
VFIAX was launched in November 2000 as the Admiral Shares class of Vanguard’s 500 Index Fund. Vanguard’s official fund information lists VFIAX under fund number 0540 and reports a 0.04% expense ratio.
The fund’s objective is straightforward: track the investment performance of the S&P 500 Index.
Current third-party data lists approximately 518 holdings, while Vanguard’s strategy is designed around the securities represented in the S&P 500.
For investors researching VFIAX stock holdings, the most useful approach is to examine the fund’s current portfolio rather than relying on an old list, because company weights change as market values change.
VFIAX Stock Price History
Recent historical data shows that VFIAX reached $720.28 in August 2026 before moving lower into September. It closed at $713.56 on September 4, $708.02 on September 11, $704.62 on September 14, $701.57 on September 15, and $698.46 on September 16.
That short-term movement illustrates why looking at a single day’s VFIAX price can provide only a limited view of the fund.
For longer-term analysis, investors can examine annualized returns, total returns, distributions, fees, and benchmark tracking.
VFIAX Stock Price Today: What Should You Check?
If you’re checking VFIAX stock price today, look at these five pieces of information together:
- Latest NAV: The most recent per-share value.
- Daily change: How much the NAV moved from the previous valuation.
- S&P 500 performance: The benchmark that VFIAX seeks to track.
- Distributions: Dividends and other fund distributions.
- Long-term returns: Performance over several years rather than one session.
For September 17, 2026, the latest verified closing figure available at the time of this article is $698.46 from September 16. A new end-of-day NAV should become available after the September 17 trading session.
Frequently Asked Questions
What is the VFIAX stock price today?
The latest verified VFIAX closing NAV available as of September 17, 2026 is $698.46, recorded on September 16, 2026. VFIAX is a mutual fund, so its NAV is calculated once per business day rather than continuously like a stock or ETF.
Is there a live VFIAX stock price?
Not in the same sense as an actively traded stock or ETF. VFIAX is a mutual fund and receives an end-of-day NAV. During the trading session, the underlying stocks can move continuously, but VFIAX’s official daily NAV is calculated after the market closes.
What was the VFIAX price in 2022?
VFIAX’s price changed throughout 2022 as the S&P 500 declined significantly during that year’s market downturn. For an exact historical date in 2022, use a historical NAV database rather than relying on a single annual figure.
What was the VFIAX price in 2021?
VFIAX rose substantially during 2021 along with the broader U.S. equity market. The exact VFIAX NAV depends on the specific trading date because mutual fund NAVs change each business day.
How does VFIAX compare with VOO?
Both VFIAX and VOO are designed to provide exposure to the S&P 500. The primary structural difference is that VFIAX is a mutual fund while VOO is an ETF. VOO trades throughout the market day, whereas VFIAX is priced at its daily NAV.
Does VFIAX pay a dividend?
Yes. VFIAX distributes investment income to shareholders. Vanguard’s 2026 distribution calendar confirms quarterly distribution dates for the fund.
What stocks does VFIAX hold?
VFIAX holds securities represented in the S&P 500. Its portfolio therefore includes major U.S. large-cap companies, with individual weights determined primarily by their representation in the benchmark.
Where can I find VFIAX stock price history?
VFIAX historical NAV data can be found through Vanguard and financial-data providers. Recent September 2026 data shows a September 16 close of $698.46.
How does VFIAX compare with VTSAX?
VFIAX tracks the S&P 500, while VTSAX is designed to provide broader U.S. stock-market exposure. Vanguard describes its total-stock-market strategy as holding thousands of U.S. stocks.
Read More…
Global Economic Outlook 2026–2027
SDGE Peak Hours 2026
Jane Street News
ETF vs Mutual Fund