
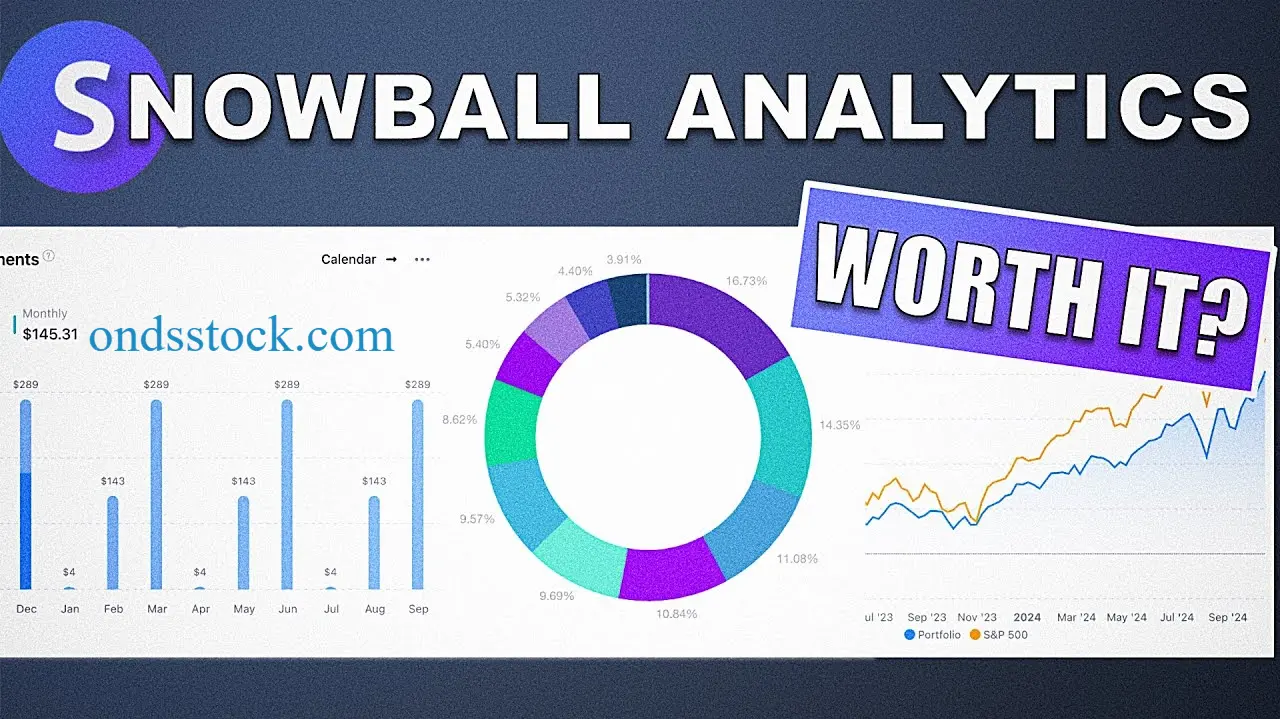
If you manage investments across multiple brokerage accounts, spreadsheets can quickly become difficult to maintain. Snowball Analytics is designed to bring those investments into one portfolio dashboard while adding dividend tracking, performance analytics, benchmarking, rebalancing tools, and historical analysis.
The platform is particularly relevant to dividend investors because it can track expected and received dividend income, calculate dividend yield and yield on cost, show dividend events, and provide tools for analyzing dividend-focused portfolios. It also supports broader investment portfolio tracking rather than limiting users to dividend stocks.
As of September 2026, Snowball Analytics offers a free tier, paid plans, brokerage connections, broker-report imports, web access, and mobile apps. Its current pricing page lists Free, Starter, Investor, and Expert plans, while the company says its platform supports more than 1,000 brokers, 70+ exchanges, and 30+ currencies.
What Is Snowball Analytics?
Snowball Analytics is a portfolio management and investment tracking platform for investors who want to consolidate holdings, transactions, income, and performance in one place.
The service organizes an investment portfolio into holdings, categories, transactions, and income. Investors can connect supported brokerage accounts or import broker reports and transaction data. Snowball Analytics says brokerage connections can synchronize holdings and transactions automatically, reducing the need for manual updates.
Its feature set covers several areas:
- Stock and ETF portfolio tracking
- Mutual fund tracking
- Dividend income tracking
- Dividend calendars
- Portfolio performance calculations
- Asset allocation analysis
- Portfolio benchmarking
- Rebalancing
- Investment backtesting
- Company fundamentals
- Risk metrics
- Multiple currencies
- Custom assets
- Mobile portfolio tracking
That makes it broader than a simple stock portfolio tracker.
How Does Snowball Analytics Work?
The basic workflow is relatively straightforward.
- Create an account and portfolio.
- Connect a brokerage account when supported.
- Alternatively, import a broker report or CSV transaction history.
- Let the platform organize holdings and transactions.
- Monitor portfolio performance, dividends, allocation, and other metrics.
Snowball Analytics currently supports automatic brokerage connections through third-party aggregation services. Its documentation identifies Yodlee and SnapTrade among the services used for brokerage connections, while the company’s newer business offering also lists Plaid.
For users whose brokerage cannot be connected, broker reports and CSV imports provide another route.
What Investments Can You Track?
Snowball Analytics is designed as a multi-asset portfolio tracker, rather than a tool limited to individual stocks.
The platform supports stocks, ETFs, funds, cash accounts, and custom assets. Its mobile application also describes support for non-exchange-traded assets such as loans, deposits, real estate, and other investments.
Stocks, ETFs, and Funds
Investors can monitor traditional market investments and organize them within portfolios and categories.
The company says users can track thousands of stocks, ETFs, and funds across 70+ exchanges and 30+ currencies.
This makes the platform useful for investors with both U.S. and international holdings. snowball-analytics.com
Alternative Assets and Custom Holdings
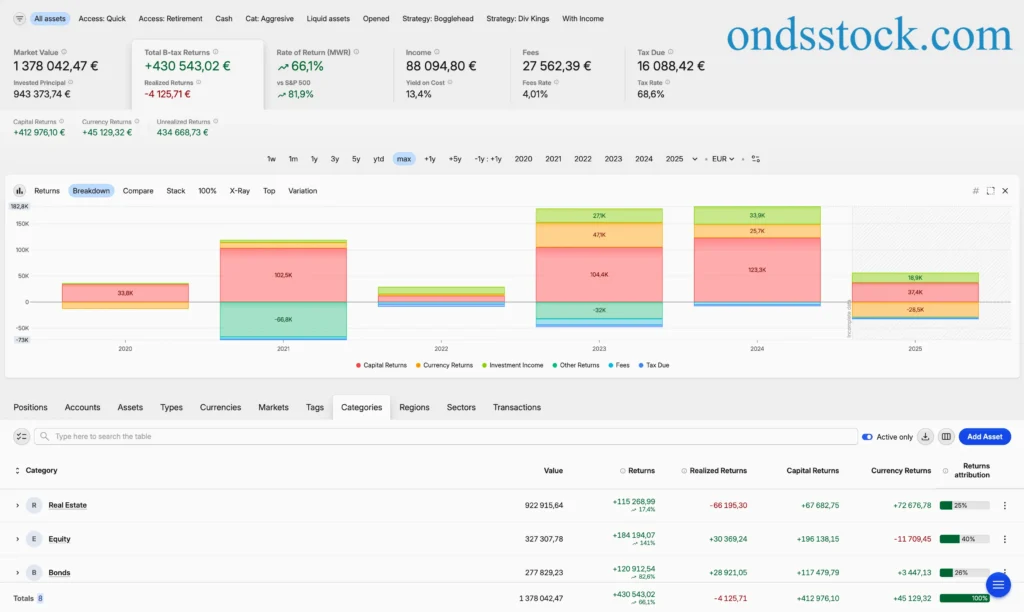
The platform also supports custom holdings. These can be useful when your complete financial picture includes assets that are not easily represented as publicly traded securities.
For example, you might want to include:
- Real estate
- Deposits
- Loans
- Private investments
- Other manually tracked assets
The exact treatment of each asset can differ from exchange-traded investments, so users should verify how a particular custom holding affects their analytics.
Dividend Tracking and Dividend Analytics
Dividend tracking is one of Snowball Analytics’ central features.
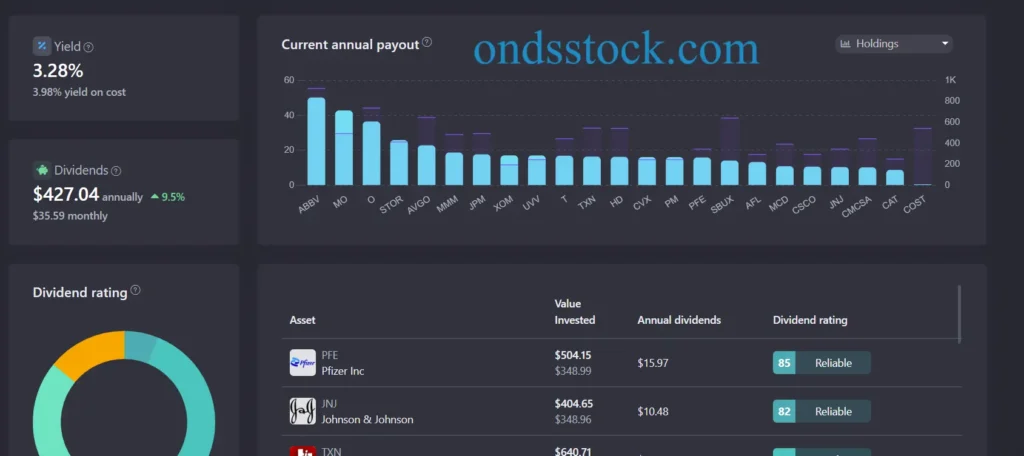
The platform can automatically track dividends, show expected and received payments, calculate dividend yield and yield on cost, and provide a dividend calendar. Paid plans also add dividend ratings and expanded dividend-stock screening tools.
For income investors, this can help answer practical questions such as:
- How much dividend income is expected?
- Which holdings generate the most income?
- How has dividend income changed?
- What dividends are coming next?
- What is the portfolio’s dividend yield?
- How does yield on cost compare with the current yield?
Snowball Analytics also provides dividend growth information, making it useful for investors interested in building a long-term passive income strategy.
However, dividend forecasts are estimates rather than guarantees. A company can change, reduce, suspend, or eliminate a dividend.
Portfolio Performance Analysis
A portfolio tracker becomes much more useful when it can distinguish between simple account value and actual investment performance.
Snowball Analytics says its performance calculations can account for factors including fees, dividends, and trades, and it also provides IRR calculations. Its analytics include portfolio returns, diversification, multi-period analysis, and benchmark comparisons.
The platform also provides metrics such as:
- Sharpe ratio
- Beta
- Portfolio returns
- Holding performance
- Asset allocation
- Sector exposure
- Regional exposure
- Historical performance
This can give investors more context than simply looking at whether their account balance increased.
Portfolio Benchmarking
Benchmarking allows investors to compare portfolio performance with market references.
Snowball Analytics lists benchmarks including major indices such as the S&P 500 and Nasdaq, with broader benchmarking functionality available at higher subscription levels.
Benchmarking should be interpreted carefully. A portfolio holding dividend stocks, bonds, international securities, and alternative assets may not be meaningfully comparable with a single U.S. equity index.
Portfolio Rebalancing and Asset Allocation
Snowball Analytics includes portfolio rebalancing tools designed around target allocations.
This can be useful when an investor has a defined asset allocation strategy and wants to determine what purchases could move the portfolio closer to those targets.
For example, suppose your target allocation contains:
| Asset Category | Target |
|---|---|
| U.S. Stocks | 50% |
| International Stocks | 20% |
| Bonds | 20% |
| REITs | 10% |
If market movements cause those percentages to drift, a rebalancing tool can help identify the gap.
Snowball Analytics says its Free plan includes a limited rebalancing tool, while higher plans provide more advanced rebalancing functionality.
Backtesting and Historical Analysis
Another feature worth considering is portfolio backtesting.
Snowball Analytics allows users to test portfolio ideas against historical data. Its current pricing information lists up to 10 years of historical portfolio testing on lower tiers and 30+ years on Investor and Expert plans.
Backtesting can be useful for examining how a hypothetical strategy behaved during previous market periods.
But historical performance does not guarantee future returns. Backtests also depend on assumptions, available historical data, portfolio construction, and transaction rules.
Is Snowball Analytics Safe?
Snowball Analytics says it does not store users’ brokerage credentials and that connected brokerage access is read-only.
Its security information states that portfolio data is depersonalized and encrypted at rest. Its privacy policy also says TLS encryption is used to protect certain information during transmission.
The brokerage connection process is handled through third-party aggregators. Snowball’s documentation explains that Yodlee connections import holdings and transactions automatically, with synchronization occurring nightly.
This distinction matters:
Snowball Analytics is a portfolio tracking platform, not a brokerage account. It does not need to execute trades for you simply because your investment information is connected.
As with any financial-data service, users should still review the current privacy policy, connection permissions, account security settings, and third-party aggregator terms before linking an account.
Data Import and Automatic Synchronization
Snowball Analytics offers several ways to bring investment information into the platform.
Brokerage Connections
Supported brokerage connections can automatically synchronize holdings and transactions. The company says it supports more than 1,000 brokers.
Broker Reports
If direct synchronization is unavailable, investors can import supported broker reports.
CSV Import
Snowball also supports custom CSV files for trade-history imports.
This flexibility is important because brokerage support can vary by country, institution, account type, and connection provider.
Multi-Currency and International Investing
Snowball Analytics is not restricted to U.S.-dollar portfolios.
The company currently advertises support for 30+ currencies and 70+ exchanges, allowing users to track investments across different markets and view portfolio performance in a selected currency.
That can be useful if your investment portfolio contains securities from the U.S., UK, Europe, Canada, or other international markets.
Currency movements can affect reported portfolio returns, however. A foreign stock can rise in its local currency while producing a different return when converted into your portfolio’s base currency.
Snowball Analytics Pricing in 2026
As of September 18, 2026, Snowball Analytics lists four main individual plans: Free, Starter, Investor, and Expert. The pricing page currently shows an autumn promotional discount, so promotional prices should not be treated as permanent rates.
| Plan | Current annual price shown | Main limits/features |
|---|---|---|
| Free | $0 | 1 portfolio, 10 holdings |
| Starter | $55.99/year | Unlimited holdings, brokerage linking |
| Investor | $104.99/year | 10 portfolios, full benchmarking, reports |
| Expert | $174.99/year | Unlimited portfolios and holdings |
The company also advertises a 14-day trial without requiring a credit card. After the trial, users can continue on the Free plan, subject to its limits.
Because promotional pricing can change, check the official pricing page before purchasing.
Snowball Analytics App and Login
Snowball Analytics is available through the web and mobile applications.
The iOS listing describes the app as a portfolio and dividend tracker, while Google Play lists features for consolidating brokerage accounts, tracking investments, monitoring dividends, and managing multiple asset types.
The mobile experience can be useful when you want to check:
- Portfolio value
- Investment performance
- Dividend events
- Holdings
- Market information
- Portfolio goals
For account access, users can log in through the Snowball Analytics service rather than needing a separate desktop application.
Snowball Analytics vs Sharesight
Snowball Analytics and Sharesight overlap significantly, but their feature emphasis and plan structures differ.
Sharesight currently offers a free plan with one portfolio and up to 10 holdings. Its paid plans provide progressively larger portfolio limits and reporting functionality. The company also emphasizes performance and tax reporting, global markets, dividend tracking, and multi-currency valuation.
Snowball Analytics similarly offers a free 10-holding tier and focuses heavily on dividend analytics, portfolio performance, rebalancing, benchmarking, and backtesting.
The practical difference is therefore less about whether either platform can track investments and more about which workflow and feature set matches your portfolio.
Snowball Analytics vs Other Portfolio Trackers
The market includes several other portfolio management tools.
Kubera is positioned more around comprehensive financial balance-sheet tracking and complex multi-entity wealth. Its current Essentials plan is listed at $250 per year, while Kubera Black is designed for more complex ownership structures.
Delta, meanwhile, provides investment tracking across wallets, brokers, exchanges, and other accounts, with free and paid tiers. Its 2026 documentation describes Delta Basic, PRO, and PRO+ plans.
This means there is no single feature that defines the entire portfolio-tracking market. Investors should compare asset support, data connections, reporting, tax requirements, mobile access, and price.
Is Snowball Analytics Free?
Yes. Snowball Analytics has a free plan.
The current Free plan allows one portfolio and up to 10 holdings and includes features such as dividend tracking, a dividend calendar, broker-report imports, basic benchmarking, and performance analytics.
There is also a 14-day full-feature trial without a credit card.
The Free plan can therefore be used to test the platform before deciding whether additional portfolios, unlimited holdings, brokerage synchronization, or advanced analytics justify a paid subscription.
Snowball Analytics Free Alternatives
If you want to compare alternatives, consider:
- Sharesight: portfolio performance, dividend, tax, and reporting tools.
- Delta: mobile-focused investment tracking across brokers, wallets, and exchanges.
- Kubera: broader net-worth and complex-asset tracking, particularly for users managing multiple entities.
The right alternative depends on whether your priority is dividend investing, tax reporting, crypto tracking, multi-entity wealth management, or mobile monitoring.
Frequently Asked Questions
Snowball Analytics login: How do I access my account?
You can access Snowball Analytics through its web service and use the mobile application for portfolio monitoring. Your subscription and portfolio data are associated with your Snowball Analytics account.
Can I download Snowball Analytics?
Snowball Analytics provides mobile applications for iOS and Android. The iOS App Store and Google Play listings identify the official app as Snowball Analytics: Stocks.
Is Snowball Analytics safe?
Snowball Analytics says it does not store brokerage credentials, uses read-only connections, and encrypts data at rest. Its privacy documentation also describes TLS protection for certain data transmitted to the service.
Does Snowball Analytics track crypto?
Snowball Analytics supports a broad range of investment assets and custom holdings, but the exact availability of cryptocurrency instruments and automatic synchronization can depend on the supported asset or connection. Check the current platform support list before relying on it for a specific crypto portfolio.
Is Snowball Analytics available as an app?
Yes. Official iOS and Android listings are available, with the mobile product providing portfolio and investment tracking functionality.
Is Snowball Analytics free?
Yes. There is a permanent Free plan with one portfolio and 10 holdings. A 14-day trial provides access to broader functionality without requiring a credit card.
Snowball Analytics vs Sharesight: what should you compare?
Compare the two services based on your actual requirements, particularly dividend analytics, tax reporting, portfolio limits, brokerage integrations, benchmarking, multi-currency support, and historical analysis. Sharesight currently emphasizes performance and tax reporting, while Snowball Analytics offers extensive dividend, rebalancing, benchmarking, and backtesting features.
Is there a free alternative to Snowball Analytics?
Yes. Sharesight and Delta both offer free options, although their free-plan limits and feature sets differ. Sharesight currently allows up to 10 holdings on its Free plan, while Delta offers a free Basic version with portfolio tracking.
Final Takeaway
Snowball Analytics is built for investors who want more than a basic stock portfolio tracker. Its combination of dividend tracking, portfolio performance analysis, brokerage synchronization, benchmarking, rebalancing, asset allocation, and historical backtesting makes it a broad investment tracking platform.
Its Free plan provides a practical way to test the service, while paid tiers expand portfolio limits and advanced analytics. Security is also an important part of the platform’s design, with the company stating that brokerage credentials are not stored and connected accounts are read-only.
For dividend investors, the dividend calendar, yield calculations, dividend growth information, and income tracking can be particularly useful. For broader investors, the more important features may be performance calculations, benchmarking, diversification analysis, and portfolio planning.
The most useful approach is to test the free version with your own holdings and compare its reporting, data synchronization, and analytics against the alternatives that matter to you.
Also Read…
Verizon Dividend History Chart
On Cloud Shoes 2026
Selective Attention
Domino’s Bankruptcy