

EXE stock represents Expand Energy Corporation, a major independent natural gas producer in the United States. The company operates in an industry where commodity prices, energy demand, production costs, and financial performance can significantly influence share prices. Investors researching EXE often want to understand its current valuation, dividend income, analyst forecasts, and potential risks before making an investment decision.
As of October 16, 2026, the market data provided lists EXE at $91.48 per share, with a market capitalization of approximately $21.18 billion. The reported dividend yield is 2.51%, while the price-to-earnings ratio is around 7.90. These figures offer a useful starting point, but they can change throughout the trading day. This guide explores the company’s performance, financial outlook, dividend, and important considerations for investors.
What Is EXE Stock?
Expand Energy Corporation is an independent energy company focused primarily on natural gas production, alongside oil and natural gas liquids. The business operates across major US shale regions, including the Haynesville and Appalachian basins. Its production activities connect the company to broader energy markets, where changes in supply, demand, infrastructure, and commodity prices can affect revenue and profitability.
The company previously operated as Chesapeake Energy Corporation before adopting the Expand Energy name in October 2024. Investors can find its common shares under the EXE ticker on the Nasdaq exchange. Understanding this corporate background helps readers identify the correct security when reviewing financial statements, market commentary, dividend announcements, and analyst research.
EXE Stock Price Today and Recent Performance
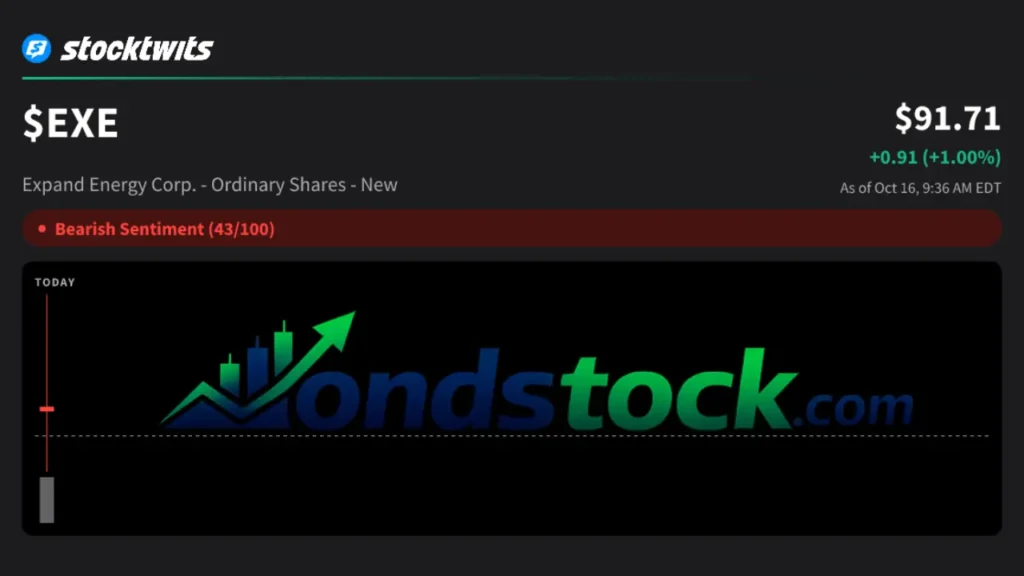
The supplied market snapshot shows EXE trading at $91.48 on October 16, 2026, at 9:33 a.m. Eastern Time. The share price was up $0.68, or approximately 0.75%, at that moment. The reported opening price was $90.80, and the day’s trading range extended from $90.80 to $91.68. These figures describe a specific point in time rather than a guaranteed current quote.
| Market metric | Reported value |
|---|---|
| Stock price | $91.48 |
| Daily change | +0.75% |
| Market capitalization | $21.18 billion |
| P/E ratio | 7.90 |
| 52-week high | $126.62 |
| 52-week low | $83.25 |
| Dividend yield | 2.51% |
| Quarterly dividend | $0.57 |
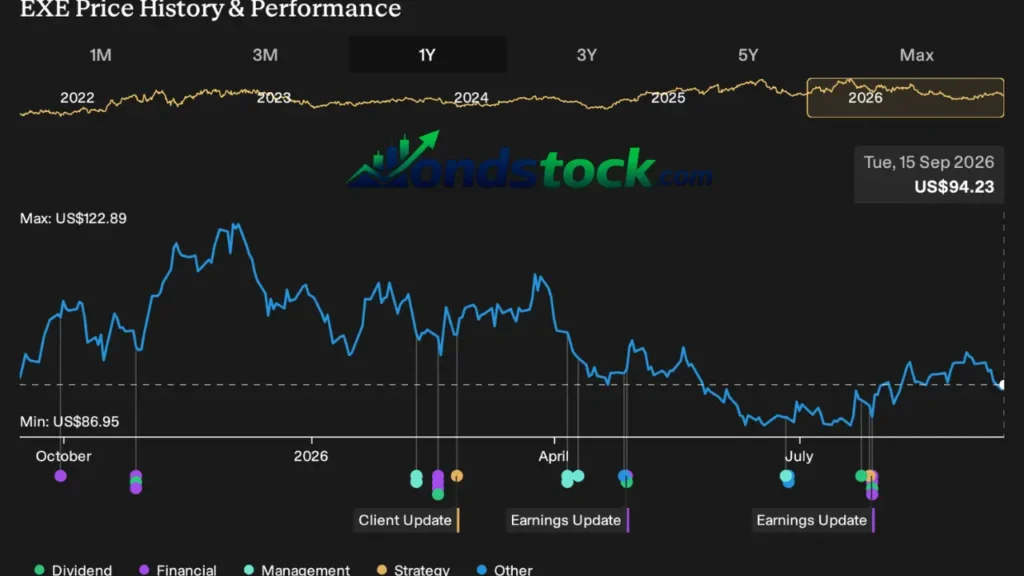
The 52-week range indicates that the shares have experienced meaningful price fluctuations. At $91.48, the stock was approximately 27.8% below its reported 52-week high and about 9.9% above its low. These comparisons provide historical context, but they do not establish whether the shares are undervalued or likely to recover. Investors should examine the reasons behind price movements and compare current results with the company’s longer-term performance.
EXE Stock News and Latest Company Updates
Recent headlines in the supplied search results show continued attention from analysts and financial publications. One report published on October 16, 2026, stated that the company’s 12-month price target had been reduced to $122.07, implying approximately 34% upside from the reference price used in that report. Other headlines discussed year-to-date share-price weakness, a Morgan Stanley target reduction, and a favorable mention from Scotiabank.
These headlines illustrate why investors should distinguish between a share-price decline and a deterioration in the underlying business. Analyst targets reflect assumptions about future earnings, commodity prices, valuation, and market conditions. Before drawing conclusions, check the original report, its publication date, the analyst’s rating, and the financial assumptions supporting the target. Company announcements and official earnings releases are useful sources for verifying developments that may affect future performance.
Expand Energy Financial Performance
The financial information provided for the second quarter of 2026 lists revenue of approximately $2.51 billion, down 10.61% year over year. The supplied earnings summary also reports a positive 19.09% earnings-per-share surprise, alongside a negative 15.70% revenue surprise. These figures should be checked against the original earnings release because summary feeds may use different comparisons or reporting conventions.
For investors, revenue alone does not explain whether a natural gas producer is becoming more profitable. Production costs, realized commodity prices, hedging arrangements, operating expenses, and capital spending can all influence earnings and cash flow. A company may report lower revenue while managing costs effectively, or it may face pressure even when production increases. Reviewing quarterly and annual reports helps investors understand these relationships and assess whether the business can support its dividend and investment plans.
EXE Stock Dividend History and Yield
The supplied data lists a quarterly dividend of $0.57 per share and a dividend yield of 2.51%. If the quarterly payment remained at $0.57 for four consecutive quarters, the annualized dividend would equal $2.28 per share. At a share price of $91.48, that would represent an annualized yield of approximately 2.49%. The small difference from the reported yield can result from timing, rounding, or differences in the data provider’s calculation.
Dividend investors should confirm the latest declared payment, ex-dividend date, record date, and payment date before relying on a projected income figure. They should also examine operating cash flow, debt obligations, capital expenditure requirements, and management’s distribution policy. A dividend can provide an additional return component, but it does not protect shareholders from losses when the share price declines. Past payments are not a guarantee of future distributions.
EXE Stock Forecast and Price Prediction for 2026
Analyst forecasts provide one way to evaluate potential future performance, but they should not be treated as promises. The supplied news snapshot reports a 12-month price target of $122.07, while another quoted Yahoo Finance summary lists a target of $88 and a HOLD rating. These figures may come from different analysts, publication dates, or methodologies, so they should not be interpreted as a single consensus forecast.
At $91.48, a move to $122.07 would represent approximately 33.4% upside, excluding dividends and transaction costs. A decline to $88 would represent approximately 3.8% downside. These calculations illustrate the difference between two published targets, not the probability of either outcome. A useful forecast should consider natural gas prices, production performance, earnings expectations, valuation, and the assumptions behind each analyst’s research.
Why Is EXE Stock Dropping?
A decline in energy shares can reflect several overlapping factors. Natural gas prices may weaken when supply increases, storage levels rise, weather reduces demand, or consumption falls short of expectations. Since commodity prices influence the revenue a producer earns from its output, changes in market conditions can affect earnings estimates and investor confidence.
Company-specific developments can also influence the share price. Disappointing revenue, revised production guidance, higher operating costs, analyst downgrades, or broader market volatility may contribute to selling pressure. The supplied headlines mention year-to-date weakness and recent target reductions, but those headlines alone do not establish one definitive cause. Investors should compare price movements with earnings releases, industry data, and company announcements before deciding whether a decline represents a temporary setback or a more serious concern.
Is EXE Stock a Buy or Sell in 2026?
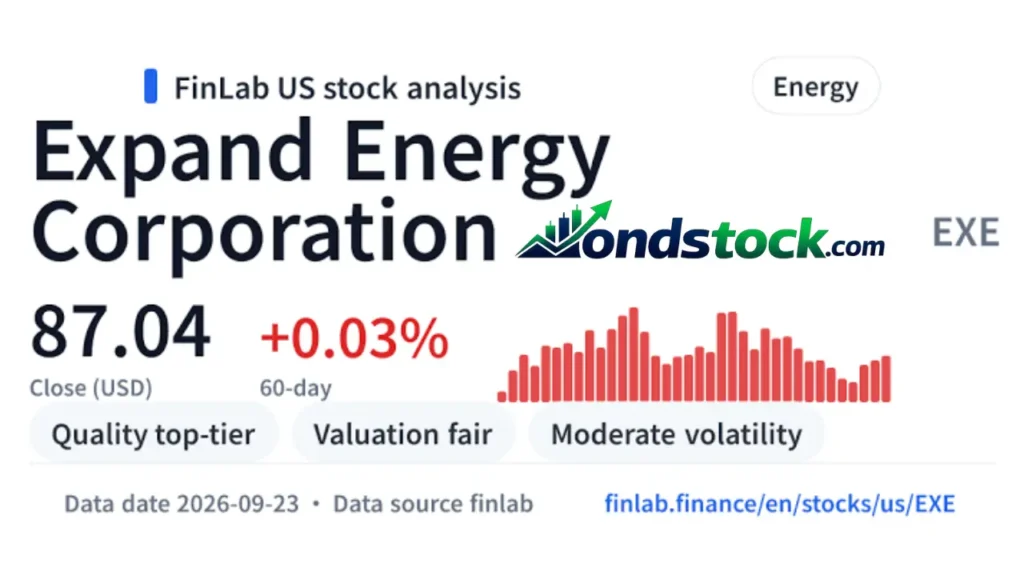
Whether the shares are attractive depends on the investor’s expectations, time horizon, and tolerance for risk. The reported P/E ratio of 7.90 may look inexpensive compared with companies trading at higher earnings multiples. However, energy-sector earnings can fluctuate significantly with commodity prices. A low valuation does not automatically mean a stock is undervalued, especially when current earnings may not reflect a normal business cycle.
Investors considering a purchase can assess several factors before making a decision:
- Valuation relative to expected earnings and cash flow.
- Natural gas market conditions and production outlook.
- Dividend sustainability and balance-sheet strength.
- Analyst forecast revisions and the assumptions behind them.
- Potential downside if commodity prices or earnings weaken.
A HOLD approach may suit someone who wants more evidence about earnings stability, while a growth-oriented investor may focus on production prospects and valuation. Neither approach is universally correct. A balanced decision should rely on verified financial information rather than a single price target or headline.
EXE Stock on Nasdaq vs. the TSX
Expand Energy Corporation’s common shares trade on Nasdaq under the ticker EXE. Searches for EXE stock on the Toronto Stock Exchange, or TSX, should be approached carefully because ticker symbols can differ between exchanges and may identify unrelated securities. Confirming the issuer’s full legal name and exchange listing helps prevent confusion when researching prices, company announcements, or investment products.
Before placing an order, check the ticker displayed by your brokerage and verify that the company name matches Expand Energy Corporation. Also confirm the trading currency, security type, and exchange. These details matter when comparing quotes from multiple financial websites because delayed prices, different currencies, and similarly named securities can lead to misleading comparisons.
Key Factors That Could Influence EXE Stock
Natural gas supply and demand are central to the company’s outlook. Weather patterns, electricity generation, industrial consumption, liquefied natural gas exports, storage levels, and pipeline capacity can all affect commodity prices. Stronger demand may support realized prices, while oversupply or transportation constraints can pressure them. These industry conditions may change quickly, making it important to review updated market information alongside company results.
Operational performance and financial discipline are equally important. Production efficiency, drilling costs, reserve development, debt management, and capital allocation can influence how much cash the company generates. Regulatory changes and environmental requirements may also affect costs or operations. Investors who monitor these factors can build a more complete picture of the business instead of relying only on daily price movements.
How to Research EXE Stock Before Investing
Start with a verified quote and check its timestamp, daily range, trading volume, and historical performance. Then review the company’s latest quarterly results, annual filings, earnings presentation, and official dividend announcements. These sources can help establish whether reported financial trends support the expectations reflected in the share price. Financial websites are useful for comparisons, but official disclosures should take priority when figures conflict.
Next, compare valuation measures with earnings expectations and cash flow rather than examining the P/E ratio in isolation. Review several analyst opinions, note when each target was published, and identify the assumptions behind their forecasts. Keep in mind that market data may be delayed and analyst estimates can change after new information becomes available. A disciplined research process helps investors separate confirmed facts from speculation and make decisions aligned with their financial goals.
Conclusion
Expand Energy Corporation offers investors exposure to the US natural gas industry, with its performance influenced by commodity prices, production results, financial management, and energy demand. The October 16, 2026, market snapshot places its shares at $91.48, with a reported dividend yield of 2.51% and a P/E ratio of 7.90. These figures provide a starting point for evaluating the company’s valuation and income potential, but they do not determine its future performance.
Before investing, review the latest financial statements, confirm the current dividend, and compare analyst forecasts with the company’s operating outlook. Pay particular attention to changes in natural gas prices, earnings expectations, and published price targets. A careful assessment of potential returns and downside risks can help investors decide whether the shares fit their individual investment strategy.
Frequently Asked Questions
What company does EXE stock represent?
EXE is the Nasdaq ticker for Expand Energy Corporation, an independent US energy company focused primarily on natural gas production.
What is the EXE stock price today?
The supplied October 16, 2026, snapshot lists a price of $91.48, but investors should check a live market source for the latest quote.
Does EXE stock pay a dividend?
The supplied data reports a quarterly dividend of $0.57 per share and a dividend yield of 2.51%; confirm the latest declared payment with the company.
What is the EXE stock forecast for 2026?
Forecasts vary by analyst and depend on assumptions about natural gas prices, production, earnings, and valuation.
What is the EXE stock price target?
The supplied reports include a 12-month target of $122.07 and another quoted target of $88, reflecting different published assessments.
Why is EXE stock dropping?
Possible factors include natural gas price changes, financial results, analyst revisions, production expectations, and broader market conditions.
Is EXE stock a buy or sell in 2026?
The decision depends on the company’s valuation, financial outlook, potential risks, and your investment goals and risk tolerance.
Is EXE stock listed on Nasdaq or the TSX?
Expand Energy Corporation trades on Nasdaq under EXE; verify the issuer and exchange before trading any similarly named security.
Also Read…