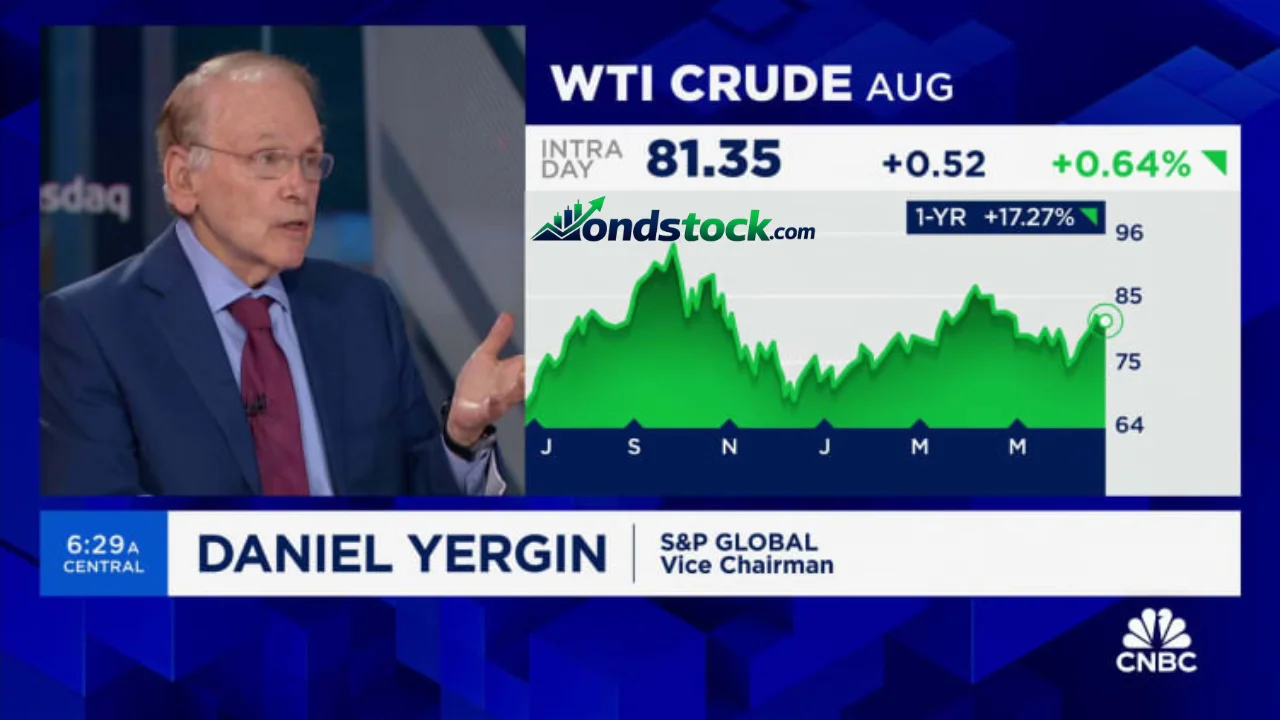
WTI oil prices today help traders, investors, businesses, and everyday consumers understand changes in the global energy market. West Texas Intermediate (WTI) is a major US crude oil benchmark, and its price reflects shifting expectations about supply, demand, economic growth, and geopolitical risks.
The latest market figures supplied for October 12, 2026, place WTI crude oil near $93.61 to $93.74 per barrel, with prices rising roughly 1.9% to 2% during the session. These are reported market quotes, not a guarantee of the current live price. Always verify the latest quote and timestamp before making a financial decision.
WTI Oil Prices Today: Latest Crude Oil Market Update
WTI crude oil is widely used to measure the value of US-produced light, sweet crude. Its price changes throughout trading sessions as buyers and sellers respond to economic reports, inventory data, production decisions, and international events. Following the market helps readers understand whether oil is gaining momentum or facing downward pressure.
The figures provided for October 12 show WTI trading above its previous close of $91.85 per barrel. One reported session range was $89.65 to $93.98. Because different platforms may display delayed quotes, different contract months, or slightly different timestamps, compare like-for-like data before drawing conclusions.
| Market indicator | Reported figure |
|---|---|
| WTI price per barrel | Approximately $93.61–$93.74 |
| Previous close | $91.85 |
| Reported trading range | $89.65–$93.98 |
| Reported daily movement | Approximately +1.9% to +2% |
| Price currency | US dollars |
| Data date | October 12, 2026 |
For updated quotes and historical data, consult Markets Insider, Investing.com, or the US Energy Information Administration. Check whether the displayed price represents a futures contract or a physical crude oil benchmark.
What Are Oil Prices Today Per Barrel?
Crude oil prices are generally quoted in US dollars per barrel, with one barrel equal to 42 US gallons. However, the price depends on the benchmark, delivery terms, contract type, and timing of the quote. When readers search for oil prices today per barrel, they should first identify whether the displayed figure refers to WTI futures, Brent futures, or a physical crude oil transaction.
Spot prices reflect the cost of crude oil for relatively prompt delivery, while futures prices represent contracts for delivery during specified future months. These prices can differ because traders consider storage expenses, expected production, transportation constraints, and future demand. For accurate comparisons, use the same currency, price unit, and observation time across all benchmarks.
WTI vs. Brent Crude Oil Prices Today
WTI and Brent are two important benchmarks used to price crude oil worldwide. WTI is closely associated with the US market and delivery at Cushing, Oklahoma. Brent represents a major international benchmark linked to crude produced in the North Sea region. Both prices respond to global energy developments, but regional supply conditions and transportation costs can cause their values to diverge.
The market data supplied for October 12 lists Brent near $106.87 per barrel and WTI near $93.84. That implies a difference of approximately $13.03 per barrel at the reported quotes. The spread can widen or narrow as regional supply changes, shipping risks develop, and demand shifts. These figures should be checked against matching timestamps before publication.
| Feature | WTI crude | Brent crude |
|---|---|---|
| Primary association | US crude oil market | International crude oil market |
| Key pricing location | Cushing, Oklahoma | North Sea benchmark region |
| Typical price unit | US dollars per barrel | US dollars per barrel |
| Main influences | US inventories, production, transport | Global supply, shipping, international demand |
| Common use | US oil pricing reference | International oil pricing reference |
Why Are Oil Prices Rising or Falling Today?
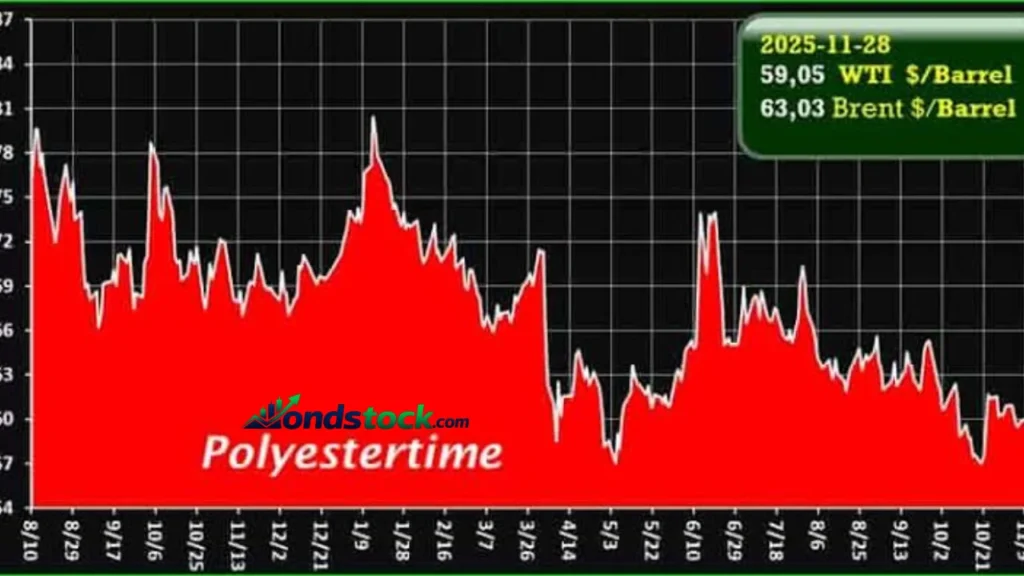
Crude oil prices move when market participants revise their expectations about available supply and future consumption. Production cuts, stronger economic activity, or disruptions to shipping routes can push prices higher. Conversely, weaker demand, increasing inventories, or rising production may create downward pressure. Traders react not only to actual events but also to expectations about what might happen next.
The supplied market summary identifies supply risks and tanker disruptions in the Middle East as possible reasons for the reported rise. Such developments can increase concern about the reliable movement of oil through important shipping routes. However, a daily price change rarely has just one cause. Inventory releases, currency movements, interest rate expectations, and broader financial market sentiment can also influence crude oil trading.
Key factors to monitor include:
- OPEC+ production targets and compliance.
- US crude oil inventory changes.
- Global manufacturing and transportation demand.
- Geopolitical tensions and shipping disruptions.
- The strength of the US dollar.
- Refinery maintenance and seasonal fuel demand.
Crude Oil Prices Today: Latest Market News
Oil market news helps explain why prices change, but readers should distinguish verified announcements from speculation. Official production decisions, government inventory reports, and confirmed shipping disruptions provide stronger evidence than unverified social media claims. When a headline appears to explain a sudden move, compare its publication time with the market chart to determine whether the news preceded the price change.
For US inventory information, the Energy Information Administration publishes petroleum supply statistics and reports. The CME Group provides information about WTI futures, while established financial news services cover market developments. These sources can help readers separate confirmed data from commentary and understand why prices may react differently to similar headlines.
WTI Oil Prices Today in 2026: Trends and Outlook
The 2026 oil market has to be evaluated through a combination of current prices, historical movements, and changing supply expectations. A single trading session cannot establish a long-term trend. For a useful outlook, compare daily prices with weekly and monthly changes, then investigate major developments during periods of sharp increases or declines.
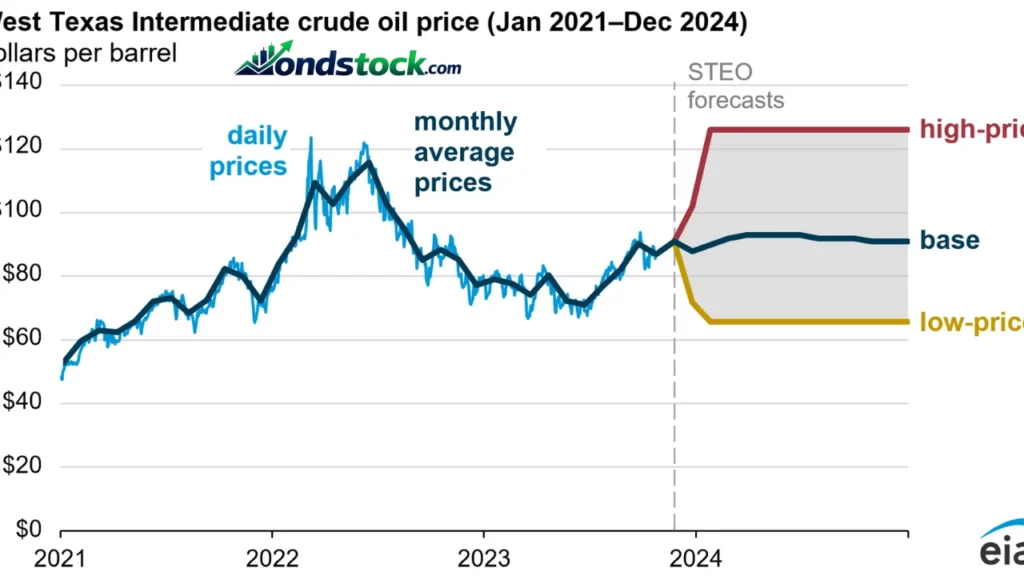
The supplied market information lists a 52-week WTI range of approximately $54.98 to $117.63 per barrel. This range illustrates how widely crude oil prices can fluctuate over a year. It does not predict where prices will go next. A sustained supply disruption could support higher prices, while weaker global demand or stronger production could weigh on the market. Forecasts should always account for uncertainty.
How to Read Today’s Oil Price Chart
An oil price chart displays how a benchmark or futures contract changes over time. The opening price shows where trading began for a session, while the high and low indicate the highest and lowest reported prices within the selected period. The previous close provides a reference point for calculating daily gains or losses. Together, these figures help readers understand the size and direction of a market move.
Percentage change is particularly useful because it measures a price movement relative to the starting value. For example, a hypothetical rise from $90 to $93 represents an increase of about 3.33%. When reviewing a chart, also check the selected contract month and time interval. A five-minute chart can tell a different story from a six-month chart, even when both display the same benchmark.
What Is the Difference Between WTI Spot Prices and Oil Futures?
Spot prices relate to crude oil bought or sold for prompt delivery under specified market conditions. Futures contracts, by contrast, establish terms for a transaction associated with a particular future delivery month. WTI futures trade on the New York Mercantile Exchange, part of CME Group. These contracts allow eligible market participants to manage exposure to oil price changes or take positions based on their expectations.
Two common terms describe the relationship between futures prices and spot prices. Contango occurs when futures prices are higher than the spot price, while backwardation generally describes a market where nearer-term prices exceed later-term prices. Storage costs, financing expenses, and immediate supply conditions can affect this structure. Futures prices are not guaranteed predictions of future spot prices, and trading derivatives carries substantial financial risk.
How Do Today’s Oil Prices Affect Gasoline and Heating Oil?
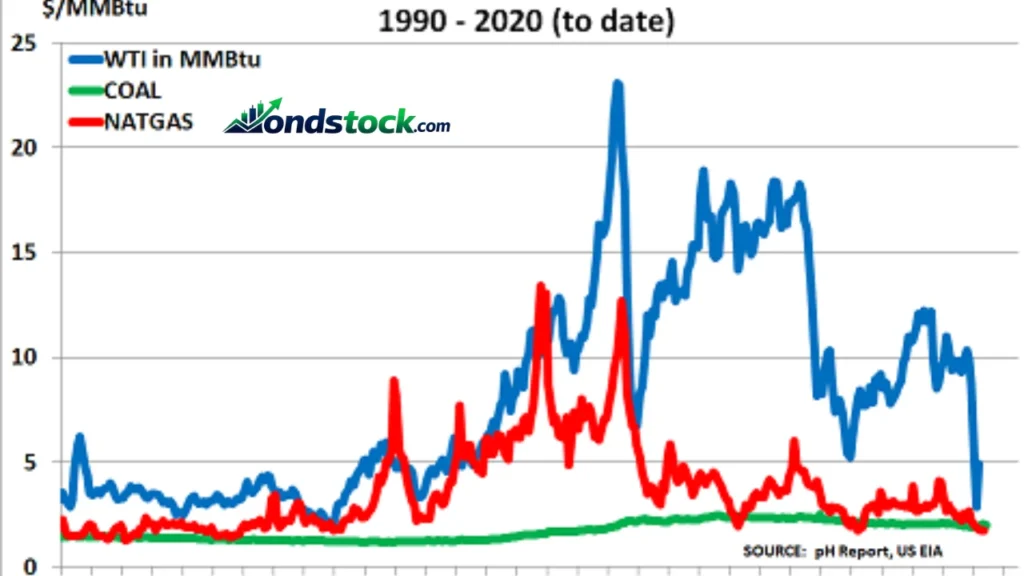
Crude oil is a major input for producing gasoline, diesel, jet fuel, and heating oil. When crude prices increase, refiners may face higher input costs, which can eventually influence wholesale and retail fuel prices. However, the relationship is not immediate or identical everywhere. Refining capacity, distribution costs, taxes, seasonal demand, and local competition also affect what consumers pay at the pump.
Heating oil prices today may follow crude oil trends, but they can also respond to colder weather, regional inventories, and seasonal consumption. Retail fuel prices may therefore rise or fall at a different pace from crude benchmarks. Consumers should compare local fuel prices and relevant petroleum data rather than assuming that every movement in the crude market will translate directly into an equal change in household energy costs.
How to Track Current Oil Prices Today
Tracking current oil prices requires reliable data, consistent timestamps, and a clear understanding of the benchmark being displayed. Some websites provide near-real-time futures quotes, while others publish delayed prices or official spot price histories. Before using a figure in an article, confirm the quote’s date, currency, unit, and contract month. This simple process helps prevent outdated or mismatched information from misleading readers.
Useful resources include:
- Markets Insider for oil price charts and market quotes.
- Investing.com for crude oil futures prices and market analysis.
- CME Group for WTI futures contract information.
- EIA for official US petroleum statistics and historical data.
- OilPrice.com for energy market news and benchmark price coverage.
What Could Move Oil Prices Next?
Future crude oil movements will depend on the balance between supply and demand, along with unexpected changes in market conditions. Upcoming inventory reports, OPEC+ announcements, economic indicators, and geopolitical developments can all influence trading. Stronger demand or significant supply interruptions may support higher prices, while rising production and weaker consumption may create downward pressure.
Rather than relying on a single forecast, readers should consider several possible scenarios. A bullish scenario could involve persistent supply constraints and resilient demand. A bearish scenario could feature rising inventories and slower economic growth. Neither outcome is certain, and unexpected news can quickly change market expectations. Anyone trading oil-related financial products should evaluate risk carefully and avoid treating short-term price targets as guaranteed outcomes.
Conclusion:
WTI remains an important benchmark for understanding the US crude oil market and broader energy price movements. Following its price per barrel, comparing it with Brent, and reviewing inventory reports can help readers interpret daily market changes. However, no single quote explains the entire market. Supply conditions, economic expectations, geopolitical developments, and futures market dynamics all contribute to price movements.
For the clearest picture, combine current quotes with reliable news and historical data. Check timestamps before comparing prices, distinguish spot prices from futures contracts, and treat forecasts as estimates rather than certainties. With these habits, you can better understand oil market developments and make more informed decisions about the information that matters to you.
Frequently Asked Questions
What is the WTI oil price today per barrel?
The supplied October 12, 2026, market quotes place WTI near $93.61 to $93.74 per barrel, but check a live market source for the latest price.
What are oil prices today for WTI and Brent crude?
The supplied quotes list WTI near $93.84 and Brent near $106.87 per barrel; verify current prices and matching timestamps before comparing them.
Why are oil prices rising or falling today?
Prices respond to supply and demand expectations, inventory reports, production decisions, economic conditions, and geopolitical developments.
What is the difference between WTI and Brent oil prices?
WTI primarily benchmarks US crude oil, while Brent is widely used as an international crude oil pricing reference.
Where can I check crude oil prices today in real time?
Check financial market platforms such as Investing.com and CME Group, and confirm whether the displayed quotes are live or delayed.
How much does a barrel of oil cost today?
The price depends on the benchmark, trading date, contract type, and market conditions, so consult a current quote for the latest figure.
How do today’s oil prices affect gasoline and heating oil?
Crude oil prices influence fuel production costs, but refining margins, taxes, transportation, weather, and local demand also affect consumer prices.
Will WTI oil prices rise or fall in 2026?
Future prices depend on changing supply, demand, inventories, economic growth, and geopolitical risks, so neither rising nor falling prices are guaranteed.
Also Read…
Why Did Kandi Technologies Fail? The Real Reasons
Maplebear Instacart: Company Profile and Stock Guide
DKL Stock: Price, Dividend History, and 2026 Investor Guide
Fortinet Chief Marketing Officer 2024: Full Profile and Leadership Insights