

Introduction
NYSEARCA: MSTY refers to the YieldMax MSTR Option Income Strategy ETF, an actively managed fund designed to generate current income through options strategies linked to Strategy Inc., formerly known as MicroStrategy. The fund offers investors a different way to seek income compared with simply holding MSTR shares. Instead of relying mainly on stock-price appreciation, its strategy focuses on collecting option premiums connected to MSTR’s price movements.
As of October 2, 2026, the provided market data shows MSTY trading around $16.36, with a 52-week range of $11.53 to $75.90. The fund has also attracted attention because of its unusually high distribution potential. However, a high distribution rate should not automatically be viewed as a conventional dividend yield because ETF distributions can have different sources and may fluctuate significantly.
What Is NYSEARCA: MSTY?
The YieldMax MSTR Option Income Strategy ETF is built around an option-income approach. According to the provided YieldMax information, the fund seeks to generate weekly income by selling call spreads on Strategy Inc. This structure gives the ETF exposure to movements in MSTR without simply holding MSTR shares as a traditional stock investment would.
The strategy creates an important trade-off. Option premiums can provide substantial cash flow when market conditions are favorable for the strategy, but the fund does not offer unlimited participation in MSTR’s upside. At the same time, investors remain exposed to significant downside and volatility risks. Understanding this structure is therefore essential before comparing the fund with conventional dividend ETFs or direct equity ownership.
MSTY’s Option Income Strategy
MSTY’s option strategy is closely connected to the unusually volatile trading behavior of Strategy and the broader Bitcoin market. When implied volatility is elevated, option premiums can become more valuable, creating greater income opportunities for an option-income fund. That relationship helps explain why distributions can appear unusually large during certain market periods.
The same mechanism can also create limitations. Option strategies do not simply transform volatility into guaranteed income. Market direction, option pricing, timing, and the structure of the positions can all influence results. Investors therefore need to examine total return, NAV changes, distributions, and market exposure together rather than judging the ETF from its distribution rate alone.
MSTY and MSTR Exposure
MSTY is designed around MSTR-related option exposure, while MSTR represents direct ownership of shares in Strategy. This distinction matters because the two investments can behave differently even when they are connected to the same underlying company. MSTR shareholders participate directly in changes in the company’s share price, while MSTY uses an actively managed options strategy to pursue income.
The relationship becomes particularly important during sharp market moves. MSTR can experience substantial price swings, and those movements can affect the option premiums available to MSTY. However, the ETF’s option structure may limit some upside participation while distributions can affect its share price and net asset value over time.
NYSEARCA: MSTY Dividend History and Distributions
Investors often search for MSTY’s dividend history because the fund is known for frequent distributions. Technically, however, it is more accurate to describe these payments as ETF distributions rather than treating them exactly like dividends from a traditional dividend-paying corporation. The amount can change substantially from one period to another depending on the fund’s strategy and market conditions.
koalagains.com
The provided data highlights the unusually high income associated with MSTY, while the fund’s materials emphasize its option-income objective. Investors researching historical payouts should examine the official distribution records rather than assuming that a previous payment will repeat. A large historical distribution can provide useful context, but it does not establish a guaranteed future income level.
MSTY Monthly Dividend Payouts
MSTY has attracted income-focused investors because of its frequent distribution structure. The fund’s option strategy can generate cash flow that is distributed to shareholders, creating a very different experience from ETFs that normally pay quarterly dividends from company earnings.
When examining these payments, investors should look beyond the headline amount. A distribution can affect the ETF’s share price and NAV, and some distributions may include return of capital. Therefore, evaluating the relationship between distributions, NAV performance, and total return provides a more complete picture than focusing only on the amount deposited into an investment account.
NYSEARCA: MSTY Yield Explained
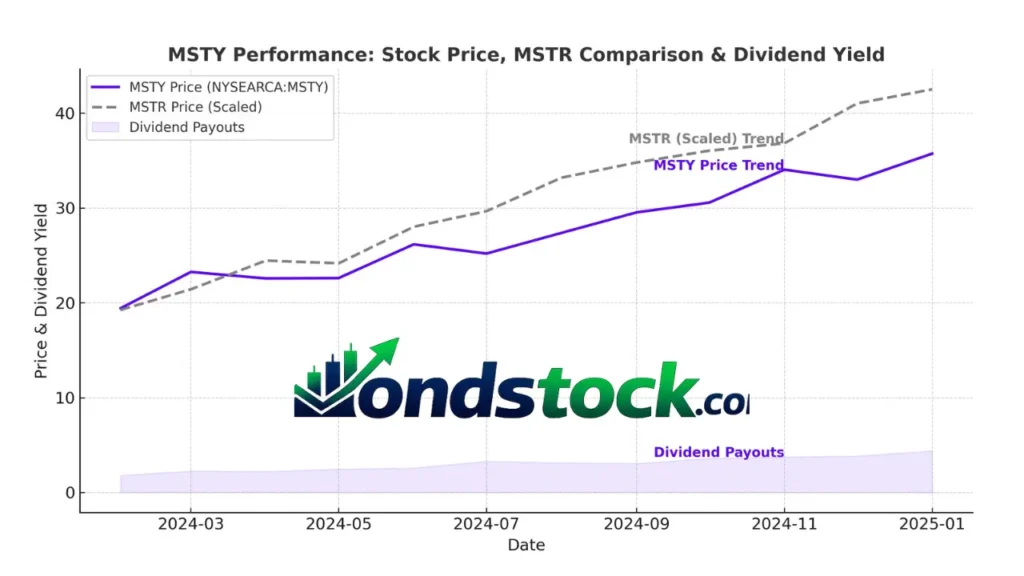
MSTY’s yield can appear exceptionally high when compared with traditional income investments. That difference is largely connected to the fund’s option strategy and the volatility of its underlying exposure. The provided market information describes the distribution rate as extremely high, driven in part by MSTR volatility and the premiums available through options.
A high distribution rate should not be interpreted as a fixed interest rate. Future distributions can rise, fall, or change materially as market conditions evolve. The following factors are particularly relevant when analyzing the fund’s income characteristics:
- MSTR price volatility
- Option premium levels
- Market direction
- Distribution policy
- Changes in NAV
- Return-of-capital considerations
What Can Affect MSTY’s Yield?
The income generated by an options-based ETF can change as the underlying market changes. Higher volatility can create larger option premiums, but extreme market movements can also produce substantial losses or reduce the effectiveness of certain positions. This makes MSTY’s income profile more dynamic than that of many conventional dividend ETFs.
Investors should also distinguish distribution rate from total investment return. Receiving a large distribution does not necessarily mean the underlying investment has increased in value by the same amount. For that reason, yield, share price, NAV, distributions, and total return should be considered together when evaluating the fund.
NYSEARCA: MSTY Price and Performance
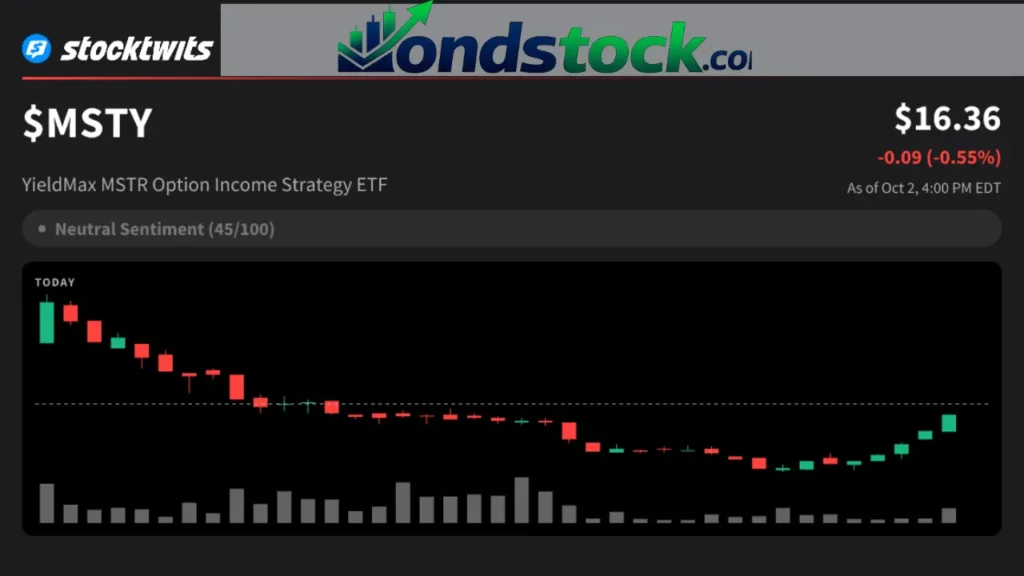
The supplied market data places the ETF at approximately $16.36 on October 2, 2026. It also shows a 52-week high of $75.90 and a 52-week low of $11.53. That wide range illustrates the level of volatility associated with the fund and its underlying exposure. Price movements of this magnitude make risk management and time horizon especially important considerations.
MSTY’s performance should not be judged solely by its current share price. Distributions form a major part of the investment experience, meaning total return provides a more useful framework. An investor examining historical performance should therefore consider changes in market price, distributions received, NAV behavior, and the broader performance of MSTR during the same period.
MSTY Performance vs. MSTR
MSTY and MSTR can move in related directions, but they are not interchangeable investments. MSTR provides direct equity exposure to Strategy, while MSTY uses options to pursue income. As a result, MSTR may capture more direct upside during powerful rallies, while MSTY’s strategy is structured around generating option-related income.
During a declining market, both investments can face pressure, although the magnitude and timing can differ. During strong rallies, MSTY may also have less upside participation because of the structure of its option positions. This makes a direct performance comparison more complicated than simply comparing two share-price charts.
NYSEARCA: MSTY Compare: MSTY vs. Other Income ETFs
When investors conduct an NYSEARCA: MSTY compare search, the most useful approach is to examine how the fund differs from other income-oriented ETFs. Some funds generate income from bonds, dividend-paying stocks, covered calls, or diversified option strategies. MSTY stands apart because its strategy is concentrated around MSTR-related exposure and therefore carries a more specific risk profile.
A comparison should include both income and risk characteristics. A fund offering a lower distribution rate may have different underlying assets, diversification, volatility, and capital-preservation characteristics. Likewise, MSTY’s high distribution potential does not make it directly comparable with a broad dividend ETF without considering how each fund generates its income.
| Factor | MSTY | Traditional Dividend ETF |
|---|---|---|
| Primary income source | Option strategy | Stock dividends |
| Main exposure | MSTR-related strategy | Diversified equities |
| Distribution pattern | Potentially frequent | Often quarterly |
| Volatility | High | Varies |
| Upside participation | Structurally limited | Generally direct |
| Main consideration | Options and MSTR volatility | Business earnings and dividends |
MSTY vs. Direct MSTR Ownership

Direct MSTR ownership gives investors an equity position in Strategy, allowing them to participate directly in changes in the company’s market value. MSTY takes a different route by using options connected to MSTR to pursue income. The distinction can become significant when the underlying stock experiences rapid upward or downward movements.
For investors comparing the two, the key issue is not simply which one has the larger distribution. Instead, the comparison should examine objectives, volatility, upside participation, income generation, drawdowns, and total return. These characteristics can produce very different investment outcomes even though both instruments are connected to the same underlying company.
Key Factors That Can Affect MSTY in 2026
The fund’s 2026 outlook is closely connected to the conditions affecting Strategy and the cryptocurrency market. Because MSTR has substantial sensitivity to Bitcoin and broader digital-asset sentiment, changes in Bitcoin volatility can indirectly influence the environment in which MSTY’s option strategy operates.
Several factors deserve attention throughout 2026:
- MSTR price volatility
- Bitcoin market conditions
- Implied option volatility
- Option premium levels
- Distribution changes
- MSTY NAV performance
- Broader equity-market conditions
- Changes to the fund’s strategy or holdings
MSTY 2026 Outlook
The 2026 outlook should be viewed as a range of possible outcomes rather than a fixed prediction. Strong MSTR volatility may create opportunities for option premium generation, while severe declines can pressure the ETF’s NAV. Similarly, calmer markets could reduce the level of premiums available to an options-based income strategy.
Investors tracking the fund should therefore monitor changes rather than relying on one historical distribution rate. Monthly or weekly income can attract attention, but the longer-term picture depends on how effectively the strategy converts option activity into distributions while managing exposure and preserving NAV.
MSTY Risks Investors Should Understand
MSTY carries several risks that can be easy to overlook when the headline distribution rate is high. Its concentrated relationship with MSTR creates single-issuer exposure, while MSTR itself can be heavily influenced by Bitcoin prices and cryptocurrency-market sentiment. This combination can make the fund substantially more volatile than many diversified income ETFs.
Another important consideration is potential capital erosion. High distributions do not automatically mean an investor is receiving pure economic profit. Depending on the source and structure of distributions, some payments can represent a return of capital. Investors should therefore monitor NAV and total return alongside cash distributions.
| Risk | Why It Matters |
|---|---|
| MSTR volatility | Can materially affect the option strategy |
| Bitcoin exposure | MSTR is influenced by digital-asset conditions |
| Limited upside | Options can restrict participation in strong rallies |
| NAV decline | Large distributions may coincide with capital erosion |
| Distribution variability | Payments can change over time |
| Concentration | Exposure is less diversified than broad-market ETFs |
How to Research NYSEARCA: MSTY Before Investing
Researching the fund requires more than checking its latest market price. Investors can begin by reviewing the official fund objective, strategy, holdings, distribution history, expense ratio, NAV, and recent performance. The supplied data lists an expense ratio of 1.03%, which is an important cost to consider when comparing MSTY with other ETFs.
It is also useful to track the relationship between distributions and NAV. A high cash payout can look attractive in isolation, but understanding how the ETF’s underlying value changes provides additional context. Investors should review official fund documents and current market information before drawing conclusions from historical figures.
Useful metrics to monitor include:
- Current share price
- Net asset value
- Distribution history
- Distribution rate
- Expense ratio
- Total return
- MSTR performance
- Bitcoin volatility
Is NYSEARCA: MSTY Suitable for Income-Focused Investors?
MSTY is designed around current income, making its structure particularly relevant to investors researching option-based income strategies. However, income potential comes with meaningful volatility and structural risks. The fund is not equivalent to a conventional dividend ETF, bond fund, or savings product, so its characteristics should be understood before making comparisons.
The most important consideration is how the fund fits within an investor’s broader objectives and risk tolerance. Someone researching income should consider both cash distributions and changes in invested capital. Looking at only one side of that equation can provide an incomplete picture of the fund’s real performance.
NYSEARCA: MSTY Key Metrics to Watch
The most useful metrics can change as market conditions develop. Current price, NAV, distributions, and total return provide a starting point, while MSTR volatility and Bitcoin conditions help explain why the fund’s income opportunity can change. Tracking these measurements over time can reveal trends that are not visible from a single day’s market quote.
The supplied October 2, 2026 data shows a price of $16.36, a 52-week low of $11.53, and a 52-week high of $75.90. Such a broad trading range demonstrates why historical price data should be considered alongside distributions and NAV rather than used alone to evaluate the ETF.
Conclusion
NYSEARCA: MSTY represents a distinctive approach to generating ETF income through an actively managed options strategy linked to Strategy Inc. Its high distribution potential has made it a notable income-focused fund, but that potential comes with substantial volatility, concentrated exposure, limited upside participation, and possible NAV erosion.
The most useful way to understand MSTY is to look beyond its headline yield. Distribution history, option strategy, MSTR performance, Bitcoin volatility, NAV changes, expenses, and total return all contribute to the bigger picture. Investors researching the fund in 2026 should use current official data and evaluate these factors together rather than relying on a single performance metric.
Frequently Asked Questions
What is NYSEARCA: MSTY?
NYSEARCA: MSTY is the ticker for the YieldMax MSTR Option Income Strategy ETF, an actively managed fund using MSTR-related options to pursue current income.
Does MSTY pay monthly distributions?
MSTY is known for frequent distributions, but payment amounts can vary and should be checked against the fund’s latest official distribution information.
What is MSTY’s dividend yield?
MSTY’s distribution rate can be unusually high, but it can change significantly and should not be treated as a fixed dividend yield.
How is MSTY connected to MSTR?
MSTY uses an options strategy connected to Strategy Inc., while MSTR represents direct ownership of Strategy shares.
How does MSTY generate income?
The fund seeks income primarily through an actively managed options strategy involving call spreads connected to MSTR.
Is MSTY different from owning MSTR?
Yes, MSTY uses an option-income structure, while MSTR provides direct equity exposure to Strategy and generally has different upside and downside characteristics.
What factors can affect MSTY distributions?
MSTR volatility, option premiums, market direction, Bitcoin conditions, and the fund’s strategy can all influence future distributions.
What should investors compare before considering MSTY?
Investors should compare distribution history, NAV performance, total return, expenses, volatility, strategy, and underlying MSTR exposure.
Also Read…