
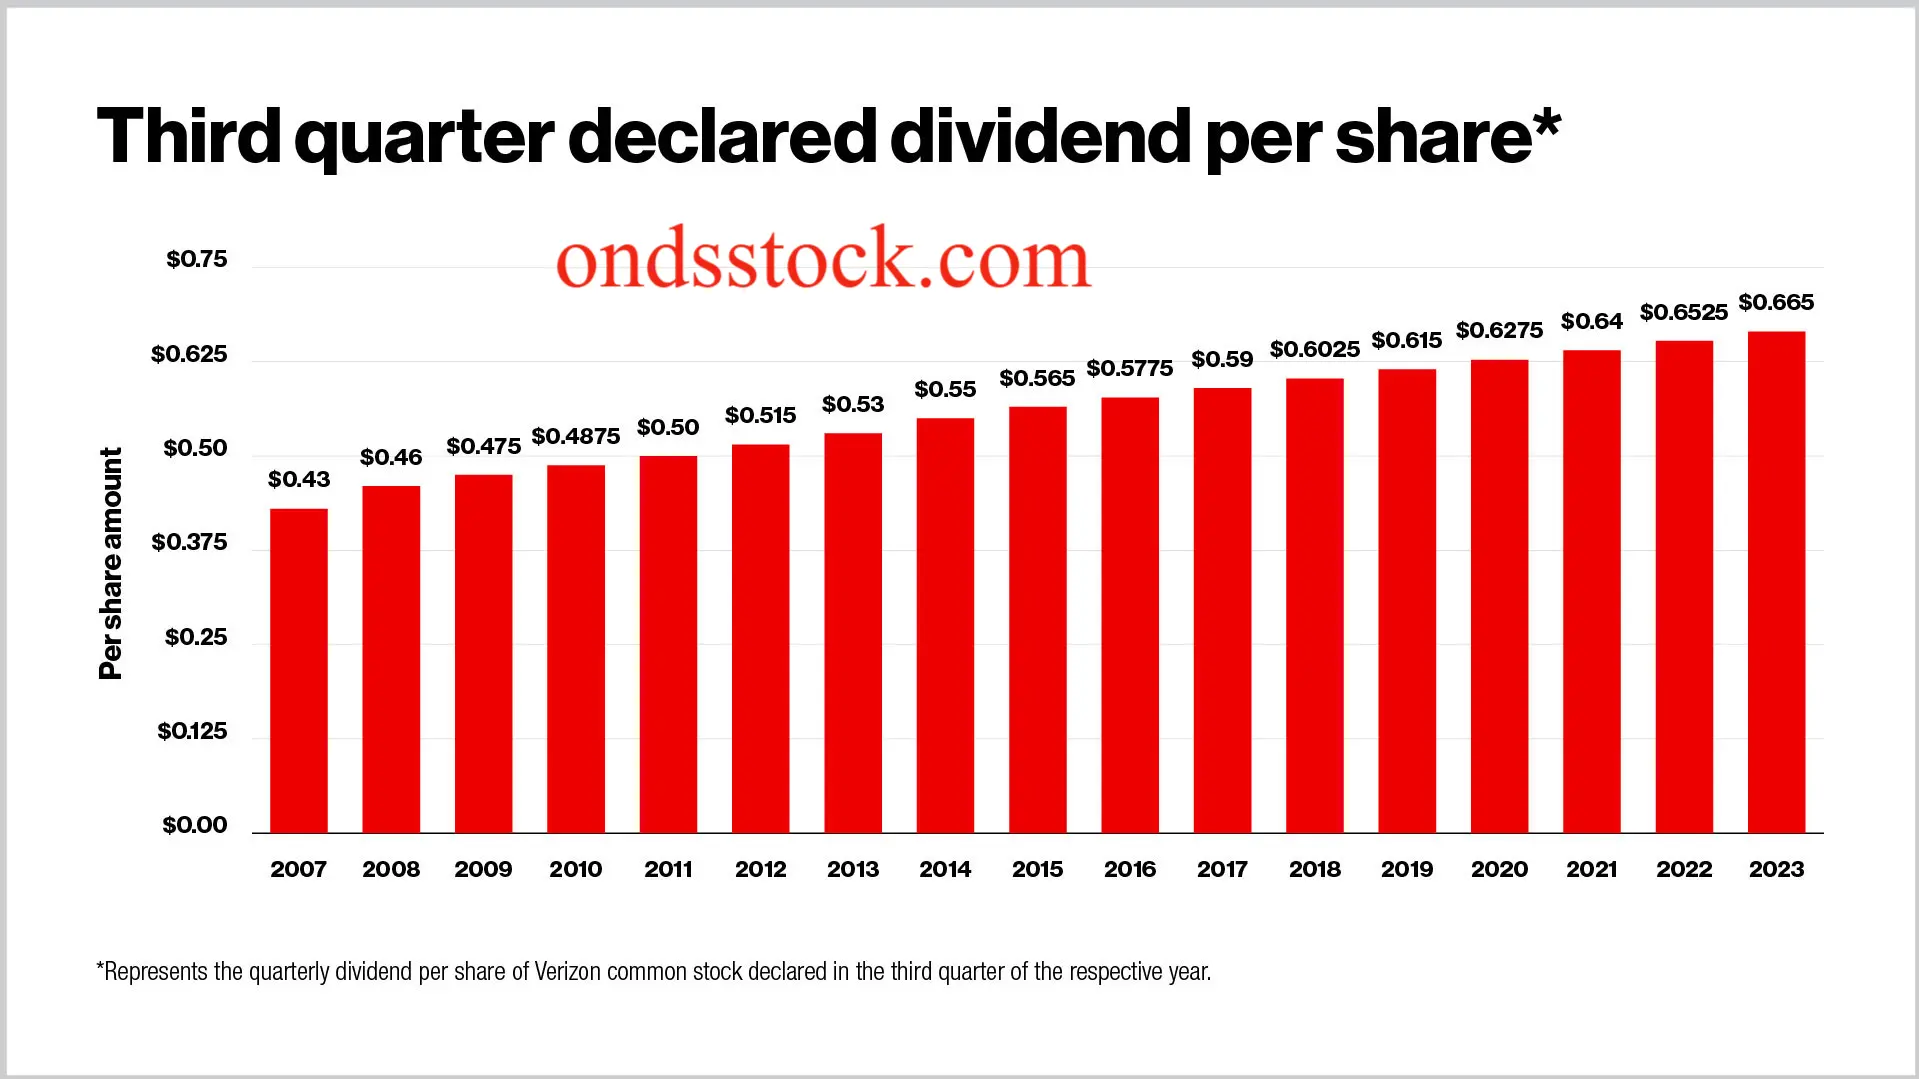
Verizon Communications Inc. (NYSE: VZ) has a long record of quarterly dividend payments. For investors researching the Verizon dividend history chart, the most useful figures are the dividend per share, ex-dividend date, record date, payment date and annualized dividend rate.
As of September 17, 2026, Verizon’s latest declared quarterly dividend is $0.7075 per share. The company declared that dividend on September 9, 2026, with an ex-dividend and record date of October 9 and a payment date of November 2, 2026. Verizon said the rate was unchanged from the previous quarter.
Based on the current $0.7075 quarterly rate, the annualized dividend is approximately $2.83 per share. A market-data source currently reports a dividend yield of about 5.69%, although yield changes with the VZ stock price.
Important: The $2.83 figure is an annualized rate based on the current quarterly payment. It is not the final 2026 calendar-year dividend total.
Verizon Dividend History and Growth
The Verizon dividend history shows a pattern of gradual increases rather than large jumps. The company has historically paid dividends on a quarterly basis, and its official records provide declaration, ex-dividend, record and payment dates.
Verizon’s current dividend history also shows that the quarterly payment increased from $0.69 to $0.7075 in 2026. Verizon described the increase announced in January 2026 as a 2.5% increase in its annualized dividend rate and said it represented its 20th consecutive year of dividend increases.
This distinction matters when analyzing dividend growth. A stock can have a high dividend yield without having rapid dividend growth. Verizon’s history is more notable for the consistency of its quarterly distribution and long sequence of increases.
VZ Dividend History Table
The following table highlights recent Verizon dividend payments and helps visualize the trend without relying only on a chart.
| Year | Quarterly Dividend Range | Annual Dividend* |
|---|---|---|
| 2026 | $0.7075 | $2.83 annualized |
| 2025 | $0.6775–$0.6900 | $2.735 |
| 2024 | $0.6650–$0.6775 | $2.685 |
| 2023 | $0.6525–$0.6650 | $2.635 |
| 2022 | $0.6400–$0.6525 | $2.585 |
| 2021 | $0.6275–$0.6400 | $2.535 |
*2026 represents the annualized current rate, while previous figures are Verizon’s reported calendar-year totals. Verizon’s official dividend history confirms these payment amounts and dates.
The pattern is straightforward: Verizon gradually increased its quarterly distribution from $0.64 in early 2022 to $0.7075 in 2026. That makes the historical table useful for anyone comparing dividend growth over several years.
What Does the Verizon Dividend History Chart Show?
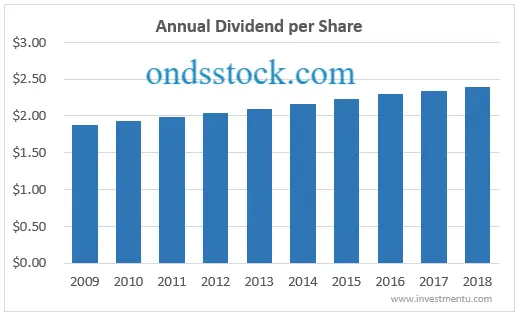
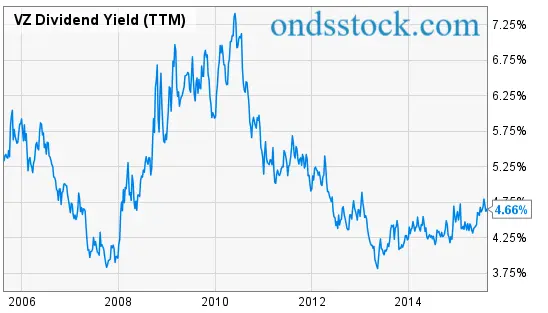
A Verizon dividend history chart is most useful when you focus on two separate trends: the dollar amount paid per share and the dividend yield.
The dividend per share has generally moved upward over the period shown above. The yield, however, can move in either direction even when the dividend remains unchanged because yield depends on the stock price.
For example:
Dividend yield = Annual dividend per share ÷ Stock price
That means a falling VZ stock price can push the dividend yield higher even without a dividend increase. Conversely, a rising share price can reduce the yield while the company continues paying the same quarterly amount.
This is why dividend investors should not interpret a higher yield by itself as evidence of stronger dividend growth or greater dividend safety.
Verizon Dividend Date and Payment Schedule
Verizon generally pays dividends four times a year. Investors researching the VZ dividend date should distinguish between the declaration date, ex-dividend date, record date and actual payment date.
For the latest 2026 declaration: seekingalpha.com
| Event | Date | Dividend |
|---|---|---|
| Declaration date | September 9, 2026 | $0.7075 |
| Ex-dividend date | October 9, 2026 | $0.7075 |
| Record date | October 9, 2026 | $0.7075 |
| Payment date | November 2, 2026 | $0.7075 |
Verizon officially announced these dates in September 2026.
What Is the VZ Ex-Dividend Date?
The ex-dividend date is the key date commonly watched by investors who want to understand dividend eligibility. Verizon’s latest announced ex-dividend date is October 9, 2026.
Dividend dates can change from one quarter to another, so investors should check the company’s latest announcement rather than assuming the next date from an older schedule.
Verizon Dividend Yield and Yield History
The Verizon dividend yield is calculated by comparing the annualized dividend with the current VZ stock price.
As of September 2026, one market-data source reports an annualized dividend of approximately $2.83 per share and a yield around 5.69%. Because VZ’s stock price changes throughout the trading day, the displayed yield can also change.
Historical yield can tell a different story from dividend growth.
For example, StockAnalysis data shows Verizon’s reported dividend yield was approximately 8.43% in 2022, 8.37% in 2023, 7.54% in 2024, and 7.05% in 2025, compared with roughly 5.69% currently.
The decline in the yield measure does not mean the dividend itself was cut. Verizon’s annual dividend per share increased over those years. The difference illustrates how important the stock price is when interpreting historical dividend yield.
Verizon Dividend Growth
Verizon’s dividend growth has been incremental. Its annual dividend per share rose from $2.535 in 2021 to $2.585 in 2022, $2.635 in 2023, $2.685 in 2024 and $2.735 in 2025. The current annualized rate is about $2.83.
In January 2026, Verizon stated that its latest increase represented a 2.5% increase in the annualized dividend rate and marked its 20th consecutive year of increases.
This is an important point when evaluating the VZ dividend growth rate. Verizon’s historical pattern is characterized by relatively small increases, which differs from companies that regularly produce much faster dividend growth.
VZ Dividend Payout Ratio
The payout ratio measures how much of a company’s earnings are distributed as dividends. It can provide context for dividend coverage, but it should not be viewed as a standalone measure of dividend safety.
As of September 2026, StockAnalysis reports a VZ payout ratio of approximately 73.73%. The same source reports dividend growth of 3.31% based on its methodology.
Payout ratios can vary depending on whether they are calculated from earnings, adjusted earnings or another financial measure. They can also change when earnings move even if the dividend remains unchanged.
For a more complete analysis, investors can examine:
- Earnings and earnings growth
- Free cash flow
- Debt levels
- Interest costs
- Capital expenditures
- Dividend coverage
- Business growth
- Cash returned to shareholders
Verizon Shareholder Yield
Shareholder yield goes beyond the dividend alone. It can incorporate dividends together with share repurchases and other capital-return measures, depending on the calculation methodology.
StockAnalysis currently reports Verizon’s shareholder yield at approximately 6.02%, consisting of its dividend yield and a reported buyback yield of about 0.33%.
Verizon also disclosed a broader capital-return plan in 2026. Its proxy statement said the company expected to return approximately $55 billion to shareholders through the end of 2028 through dividends and share repurchases, subject to the conditions and assumptions described by the company.
This provides useful context for investors researching shareholder returns rather than looking exclusively at the Verizon stock dividend.
Is the Verizon Dividend Safe and Sustainable?
Dividend safety cannot be determined from dividend history alone.
Verizon’s long record of quarterly payments and consecutive increases is one useful historical indicator. However, future sustainability depends on cash flow, earnings, debt, capital investment and the company’s dividend payout policy.
Verizon said in its 2026 earnings materials that it planned to continue investing in its business while also focusing on its dividend and balance sheet. The company also discussed a goal of reducing net unsecured leverage toward 2.0 to 2.25 times within its 2027 timeframe.
Verizon reported approximately $11.5 billion in cash dividend payments during 2025.
For dividend safety analysis, therefore, a better approach is to combine:
- Dividend payment history
- Payout ratio
- Free cash flow
- Earnings
- Debt obligations
- Balance-sheet strength
- Capital expenditure requirements
- Management’s stated dividend policy
A long history does not guarantee that future dividends will remain unchanged.
Verizon Dividend vs Other Dividend Stocks
Verizon is often examined alongside other established dividend-paying stocks because of its combination of a relatively high yield and long dividend history.
However, comparisons should use consistent metrics. A useful comparison table might include:
| Metric | Verizon VZ |
|---|---|
| Current quarterly dividend | $0.7075 |
| Annualized dividend | About $2.83 |
| Payment frequency | Quarterly |
| Current reported yield | About 5.69% |
| Reported payout ratio | About 73.73% |
| Dividend-growth streak | 20 consecutive years according to Verizon |
| Shareholder yield | About 6.02% |
Current market-based figures can change as the VZ stock price and financial results change.
The important comparison is not simply which stock has the highest yield. Investors can also examine dividend growth, cash flow, debt, valuation, sector exposure and business prospects.
VZ Dividend Performance and Key Metrics
The Verizon dividend history provides several useful signals, but each metric answers a different question.
Dividend per share: How much cash is distributed for each share?
Dividend yield: How large is the annualized dividend relative to the stock price?
Dividend growth: How quickly has the dividend increased?
Payout ratio: How much of earnings are being distributed?
Shareholder yield: How much capital is being returned through dividends and potentially buybacks?
Dividend coverage: How well are earnings or cash flows supporting the distribution?
Looking at these metrics together gives a more complete picture than focusing on a single number.
For example, Verizon’s dividend per share has increased over the recent five-year period, while its reported yield has fallen from the elevated levels seen in 2022 and 2023. That difference demonstrates why the dividend history and dividend yield history should be analyzed separately.
What Does the Verizon Dividend History Chart Tell Investors?
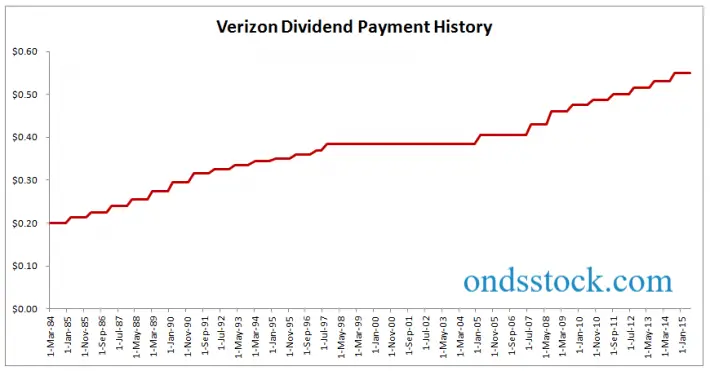
The biggest takeaway from the historical record is consistency with gradual growth.
Verizon’s official history shows quarterly distributions continuing across multiple market cycles, with the per-share payment gradually increasing. The company has also stated that 2026 marked its 20th consecutive year of dividend increases.
At the same time, a historical chart should not be treated as a forecast. Past dividend growth does not guarantee future increases, and a high historical yield does not automatically mean the stock will continue producing the same yield.
For anyone researching Verizon dividend history and growth, the most useful process is to review the payment history alongside the company’s current financial performance, cash flow, debt position and capital-allocation plans.
Frequently Asked Questions
What does the Verizon dividend history chart show for 2023?
Verizon paid a total of $2.635 per share for 2023 based on its dividend history. The quarterly payments were $0.6525 for the first two payments and $0.6650 for the later payments.
What does the Verizon dividend history chart show for 2022?
Verizon’s total dividend for 2022 was $2.585 per share. The quarterly payments were $0.64 during the first half of the year and $0.6525 during the second half.
What are the VZ dividend dates for 2026?
For the latest September 2026 declaration, the ex-dividend date and record date are October 9, 2026, while the payment date is November 2, 2026. The dividend is $0.7075 per share.
Has Verizon cut its dividend?
Verizon’s official dividend history shows continued quarterly payments and increases through the latest 2026 declaration. The current quarterly rate is $0.7075 per share.
What is the Verizon dividend in 2026?
As of September 17, 2026, Verizon’s latest declared quarterly dividend is $0.7075 per share. The current annualized rate is approximately $2.83 per share. The first three declared 2026 payments total $2.1225, while the $2.83 figure annualizes the current quarterly rate.
Did Verizon increase its dividend in 2026?
Yes. Verizon increased its quarterly dividend from $0.69 to $0.7075 in the first 2026 dividend declaration. Verizon described this as a 2.5% increase in the annualized dividend rate and its 20th consecutive year of increases.
How can I calculate my Verizon dividend income?
Multiply the number of VZ shares you own by the dividend per share.
Estimated quarterly dividend income = Shares × $0.7075
For example, 100 shares at the current quarterly rate would produce $70.75 before applicable taxes for a full quarterly payment, assuming the investor is entitled to the distribution.
How much is Verizon dividend per share?
The latest declared Verizon dividend is $0.7075 per share per quarter. At four payments per year, that equals an annualized rate of approximately $2.83 per share.
Also Read