

What Is SPYM ETF?
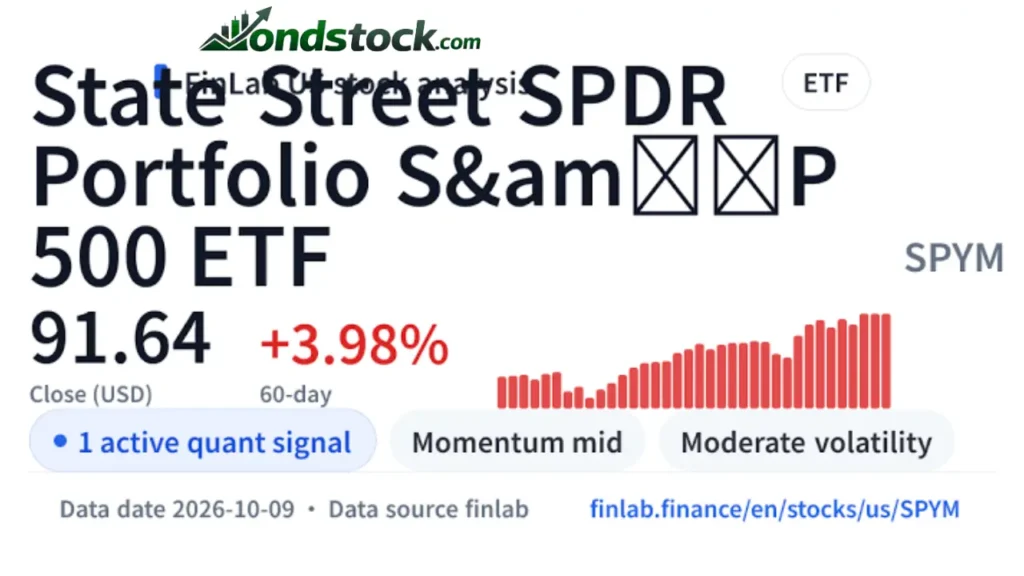
SPYM is the ticker symbol for the State Street SPDR Portfolio S&P 500 ETF, a fund designed to track the performance of the S&P 500 Index. It gives investors exposure to many large publicly traded US companies through a single investment. Instead of purchasing shares in each company individually, investors can use this ETF to access a broad segment of the American stock market.
The fund is managed by State Street Investment Management and trades on the NYSE Arca exchange. Investors often research SPYM stock to understand its price, fees, dividend distributions, and long-term potential. Although the fund provides exposure to hundreds of companies, it can still lose value when the broader stock market declines. Understanding its structure and risks is essential before investing.
SPYM Stock Price and Recent Performance
As of October 20, 2026, the market data provided lists SPYM at $90.51, up $0.28, or approximately 0.31%, for the day. The reported opening price was $90.15, while the session high reached $90.87 and the low stood at $89.98. These figures offer a snapshot of trading activity, but prices change throughout the trading session.
The same data lists a 52-week high of $92.00 and a 52-week low of $74.06. This range helps investors understand the fund’s recent price movements, although it does not predict future performance. When researching SPYM stock, consider total returns alongside price changes because distributions can contribute meaningfully to an ETF investor’s overall results. Always check a live quote before making a trade.
SPYM ETF Holdings and Portfolio Allocation
The fund holds a broad collection of US companies represented in the S&P 500 Index. According to State Street’s published holdings data for October 19, 2026, NVIDIA, Apple, Microsoft, Amazon, and Alphabet were among its largest positions. Their portfolio weights change as market prices move and the underlying index is updated.
SSGA These companies operate across technology, consumer services, communications, and other important parts of the economy.
| Top holding | Ticker | Portfolio weight |
|---|---|---|
| NVIDIA | NVDA | 7.92% |
| Apple | AAPL | 7.55% |
| Microsoft | MSFT | 5.97% |
| Amazon | AMZN | 3.88% |
| Alphabet Class A | GOOGL | 3.05% |
Source: State Street fund holdings, October 19, 2026. Weights change over time.
This portfolio provides diversification across numerous companies, but it is not equally weighted. The largest businesses can influence returns more heavily than smaller holdings. Technology also represents a substantial share of the fund’s exposure, so changes in technology valuations can have a noticeable effect on performance. Investors should review the current holdings list and sector allocation before deciding whether the fund fits their desired balance of risk and diversification.

SPYM Expense Ratio and Investment Costs
One of the fund’s main attractions is its low expense ratio. State Street reports a gross annual expense ratio of 0.02%, meaning the fund charges approximately $2 per year for every $10,000 invested, assuming the balance remains constant.
SSGA Actual costs vary with the investment’s value, and the fee is reflected in fund performance rather than usually being billed as a separate payment.
| Investment amount | Approximate annual fund expense |
|---|---|
| $1,000 | $0.20 |
| $10,000 | $2.00 |
| $50,000 | $10.00 |
| $100,000 | $20.00 |
These figures illustrate the expense ratio alone. Brokerage charges, bid-ask spreads, taxes, and other transaction-related costs may also apply, depending on the account and trading platform. Even small differences in annual fees can compound over long periods, but costs should not be the only factor in a fund comparison. Investors should also consider liquidity, tracking performance, accessibility, and the investment strategy that best matches their goals.
SPYM Dividend History, Yield and Payment Schedule
The fund distributes income generated by its underlying investments, generally on a quarterly schedule. Available historical data lists a distribution of approximately $0.2391 per share with an ex-dividend date of September 11, 2026, and a payment date of September 15, 2026.
StockAnalysis.com Future distributions may differ, so investors should verify the latest announcements rather than assume that each payment will remain the same.
Dividend yield provides an estimate of annual income relative to an ETF’s market price, but it changes as the price and distributions change. A higher yield does not automatically mean a better investment, particularly if the fund’s market value declines. Investors focused on income should examine distribution history, yield calculations, and total returns together. Reinvesting distributions may also help build long-term wealth, although reinvestment does not protect against market losses.
SPYM vs VOO: Key Differences for Investors
SPYM and the Vanguard S&P 500 ETF (VOO) both aim to provide exposure to the S&P 500 Index. Their shared benchmark means their portfolios and long-term performance patterns can be similar, although expense ratios, tracking differences, trading prices, and distribution amounts may vary. Investors comparing these funds should use matching time periods and the same assumptions about dividend reinvestment to make the comparison meaningful.
SPYM’s published gross expense ratio is 0.02%, while VOO’s current expense ratio should be checked against Vanguard’s official fund information before publication.
SSGA The practical difference between two low-cost funds may be small for some investors, so other considerations matter too. These include brokerage availability, bid-ask spreads, recurring investment features, and personal preferences. Neither fund guarantees profits, and both remain exposed to movements in the US stock market.
SPY vs SPYM: Which Differences Matter?
SPY and SPYM offer exposure to the S&P 500, but they differ in fund costs and trading characteristics. SPY is the SPDR S&P 500 ETF Trust, a long-established fund known for its substantial trading activity and options market. SPYM, by contrast, is designed to offer broad S&P 500 exposure with a low annual expense ratio. Investors should evaluate both funds based on how they plan to use them.
For long-term investors, annual fees and total returns deserve close attention. For active traders, liquidity, bid-ask spreads, and options availability may be more important. The right comparison depends on your investment approach rather than the ticker price alone. Before choosing either fund, review its official documentation and consider whether you need a long-term portfolio holding or a vehicle for frequent trading.

SPYM vs FXAIX: ETF or Mutual Fund?
FXAIX is the Fidelity 500 Index Fund, a mutual fund that also seeks to track the S&P 500. Its investment objective is similar to that of SPYM, but the two products operate differently. An ETF trades on an exchange throughout the trading day, while a traditional mutual fund generally processes purchases and redemptions at its net asset value calculated after the market closes.
This structural difference can influence how you invest. SPYM may suit investors who prefer exchange-based trading, while FXAIX may appeal to those who value automated mutual fund contributions through Fidelity accounts. Fees, minimum investment requirements, account eligibility, and available features should be checked before choosing. Investors outside the United States should also examine local regulations and tax implications, as access to US-listed investments varies by country and brokerage.
Benefits and Risks of Investing in SPYM
One potential benefit is straightforward access to a broad group of large US companies through a single investment. The fund’s low expense ratio can help limit ongoing costs, while its underlying holdings provide exposure to several sectors. Investors can also receive distributions from the fund and choose to reinvest them, depending on their brokerage’s available features.
However, diversification does not eliminate investment risk. The fund can decline during market downturns, and its market-cap-weighted structure gives larger companies greater influence over returns. Economic uncertainty, inflation, interest rates, disappointing corporate earnings, and changing valuations can all affect its performance. Before investing, consider these important factors:
- Your investment horizon and financial goals.
- Your ability to tolerate market declines.
- The fund’s current holdings, fees, and dividend history.
- Brokerage costs and applicable tax obligations.
- The role the fund would play in your overall portfolio.
SPYM Stock Outlook for 2026 and Beyond
The outlook for SPYM depends largely on the performance of the S&P 500 and the companies within it. Corporate earnings growth, interest rate decisions, inflation, consumer spending, and business investment may all influence market direction. Technology companies can also play a significant role because several large technology businesses represent substantial portions of the index. Strong earnings may support prices, but high valuations can leave stocks vulnerable to disappointing results.
Investors should avoid relying on a single price forecast when evaluating the fund’s future. Instead, examine earnings trends, economic conditions, valuation levels, and long-term historical performance. Regular contributions and a diversified investment plan may help investors maintain discipline through market fluctuations, but neither strategy guarantees positive returns. The 2026 outlook should therefore be treated as a framework for evaluating risks rather than a promise of future performance.
Conclusion
SPYM provides a convenient way to gain exposure to the S&P 500 through one exchange-traded fund. Its reported 0.02% expense ratio makes ongoing fund costs an important part of its appeal, while its holdings offer access to leading US businesses across several sectors. Investors researching SPYM stock should also examine its market price, distributions, sector concentration, and historical total returns before making a decision.
Comparisons with VOO, SPY, and FXAIX can help clarify the differences between similar investment options. The most suitable fund depends on your costs, trading preferences, brokerage access, time horizon, and tolerance for risk. Review official fund information, use current market data, and consider your financial circumstances before investing. This article is for educational purposes and does not constitute personalized financial advice.
Frequently Asked Questions
What is SPYM stock?
SPYM is the ticker symbol for the State Street SPDR Portfolio S&P 500 ETF, which seeks to track the S&P 500 Index.
What is the SPYM stock price today?
The supplied market data lists a price of $90.51 on October 20, 2026, at 11:31 a.m. EDT, but the live price may have changed.
Is SPYM a stock or an ETF?
SPYM is an exchange-traded fund that holds a portfolio of securities rather than shares in a single operating company.
What is the SPYM expense ratio?
State Street reports a gross annual expense ratio of 0.02%, equivalent to approximately $2 per year for every $10,000 invested at a constant balance.
Does SPYM pay dividends?
Yes, the fund generally distributes dividends quarterly, although payment amounts and dates can change.
What are the largest SPYM holdings?
Recent holdings include NVIDIA, Apple, Microsoft, Amazon, and Alphabet, with portfolio weights changing over time.
What is the difference between SPYM and VOO?
Both funds track the S&P 500, but their fees, trading characteristics, distributions, and tracking results should be compared using current data.
Is SPYM suitable for long-term investing?
It may suit investors seeking low-cost S&P 500 exposure, but its suitability depends on individual goals, risk tolerance, and investment horizon.
Also Read…